Information Technology Reference
In-Depth Information
a)
b) c)
d)
e) f)
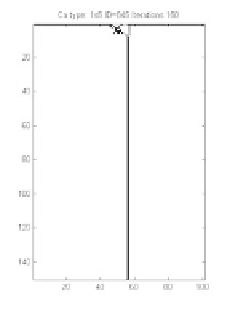
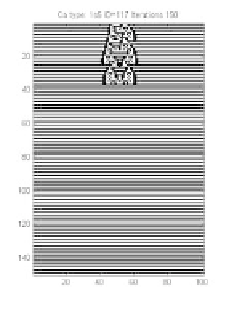
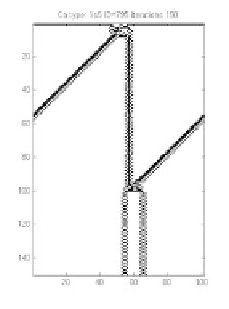
Fig. 4.2.
Different behaviors of CAs belonging to Wolfram's Class II
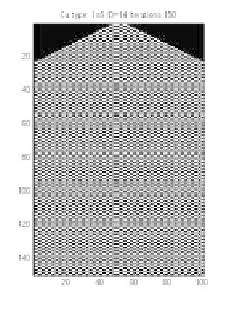
Several examples of Class III cellular automata are provided in Fig. 4.3. While all
examples in Fig. 4.3 fit within the definition of Class III, it is clear that some dif-
ferences exist, and again the
transient time
(until reaching a “stable” chaotic dy-
namics) and the
exponent of growth U
allow to differentiate among the different
behaviors belonging to the same class. The example in Fig. 4.3a is a typical Class
III behavior, with a fast growing (with the “speed of light”) towards a chaotic
dynamics. The visual observation of the pattern barely shows any sign of spatial
correlation (among cells at the same time step), and the
clustering coefficient C
is
almost equal to 0.5 indicating a perfect spatial disorder. Note that starting with the
examples in Fig. 4.3b and ending with that in Fig. 4.3f ) there is an increase in the
exponent of growth, which is greater than 1 in all cases.
Particularly for the cases with longer transients and lower exponents of growth,
there are signs of more spatial correlation which may result in a “pink noise”
rather than the “white noise” specific for the CA in Fig. 4.3a. If
clustering coeffi-
cients
would be calculated in the “stationary” chaotic regime they will deviate


Search WWH ::

Custom Search