Environmental Engineering Reference
In-Depth Information
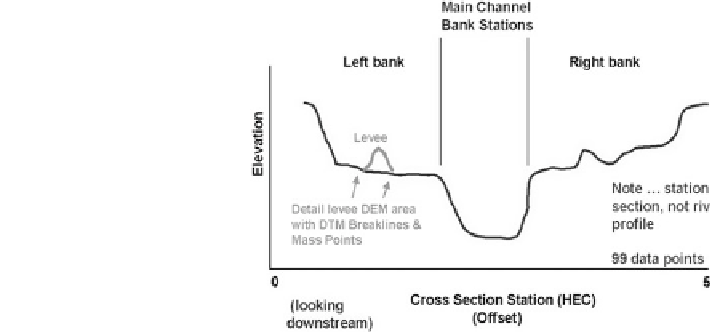
Fig. 3.6 Cross section
convention for typical river
and floodplain coverage
(Source EM 1120-2-1003
2002)
The station-elevation data were extracted along the cut line from the DEM.
ArcGIS 9.3.1 was used as support software for spatial processing of input and
output data. The location and extent of cross sections were represented by the cross
sectional cut lines layer in HEC-GeoRAS. The interval between cross sections was
150 m, with a total river section of 10 km in length. The cross sections which were
created in HEC-GeoRAS were directly imported to HEC-RAS. In HEC-RAS,
there is the possibility to interpolate the cross sections every 20 m. In order to
create a more reliable flood modeling result (2D) in HEC-RAS, the extension of
the cross sections in the floodplain area was considered mandatory. Ten cross
sections were applied along the river and the data were manually imported to
SOBEK. The schematic shape of a cross section, as a Y-Z profile created with
HEC-GeoRAS (Fig.
3.6
), was applied in HEC-RAS and SOBEK.
3.6 Discharge Data Modeling
Hydrometric data including hourly discharge (m
3
/s) and water height (m) were
defined for both models. The oldest severe flood occurred on 14 May 1957 with a
maximum discharge of 480 (m
3
/s), and the nearest flood was between 29 and 30
May 2008, with a maximum discharge of 205 (m
3
/s). Based on available hourly
discharge, the rating curve was applied between hourly height of water and dis-
charge to calculate the missing discharge value for each month.
3.7 Roughness Values
The surface roughness values are some of the most important aspects in any flood
modeling. Since it is difficult to measure surface roughness, the effectiveness of the
specified roughness values was evaluated. Different combinations of roughness
Search WWH ::

Custom Search