Environmental Engineering Reference
In-Depth Information
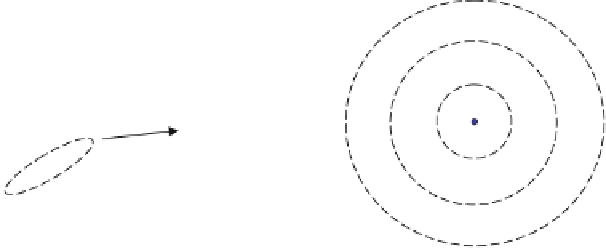
Lag: 2 km
2 km
2 km
2 km
Distance
X Coordinate
X Coordinate
Fig. 3.2
Pairing of one point (inside of red circular) with all other measured locations [
138
]
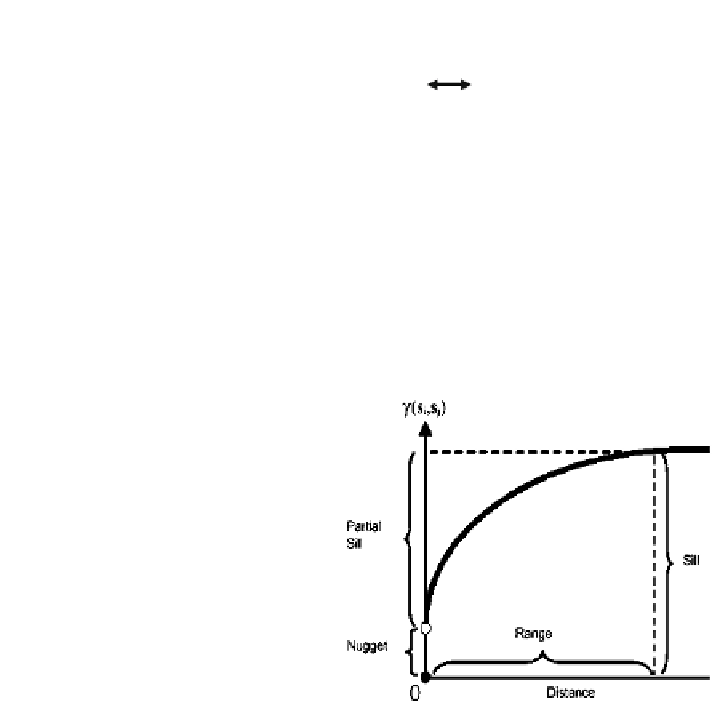
Fig. 3.3 Hypothetical
example of an empirical
semivariogram and its fitted
model; the distance where the
model first flattens out is
known as the range; the value
at which the model attains the
range is called the sill; the
value at which the model
intercepts the y-axis is called
the nugget [
6
]
semivariance for all pairs of points that are greater than 40 m apart but less than
50 m. The empirical semivariogram is defined as a graph of the averaged semi-
variogram values on the y-axis and the lag or distance on the x-axis (Fig.
3.3
).
According to Fig.
3.3,
Johnston [
6
] has defined the Lag, Range, Sill, and
Nugget as follows:
• Lag is a distance interval in which whole existing pairs are averaged (similarity
or dissimilarity) to simplify the calculation;
• Range is separation between point pairs at which the sill is reached; distance at
which there is no evidence of spatial dependence;
• Sill is maximum semivariance; represents variability in the absence of spatial
dependence;
• Nugget is semivariance as the separation approaches zero; represents variability
at a point that cannot be explained by spatial structure.
Spatial autocorrelation quantifies a basic principle of geography that the values
which are located closer are more similar than the values that are located farther


Search WWH ::

Custom Search