Environmental Engineering Reference
In-Depth Information
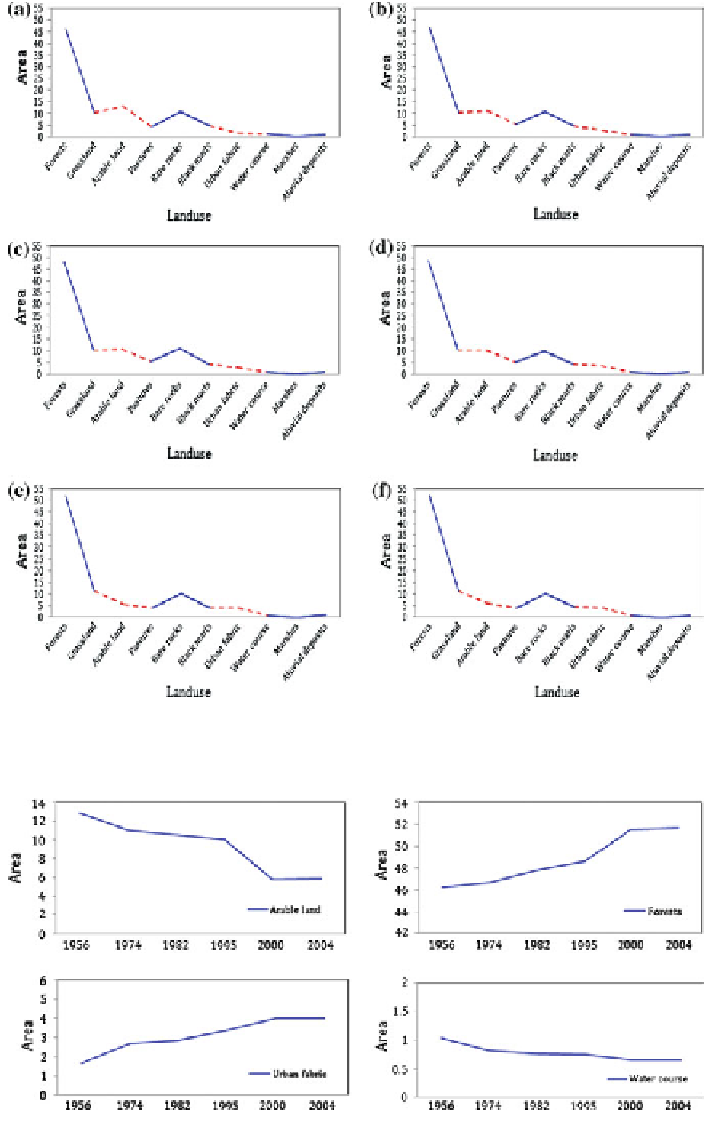
Fig. 6.83 Land use changes over time (area km
2
). a 1956, b 1974, c 1982, d 1995, e 2000, f 2004;
the red-dash line represents decreasing arable land and increasing urban areas over the time
Changes in area (km
2
); arable land, forest, urban area, and water course during 1956-2004
Search WWH ::

Custom Search