Environmental Engineering Reference
In-Depth Information
6.13 Land Use Change Modeling
to the available literature. The photographic archives of the mountain terrain
restoration (MTR) agency provided views of the watershed dating as far back as
1860. This part deals with detecting land use change during 1956-2004 based on
the available aerial photos.
The current land use categories in the study area are mostly classified into
coniferous forests (*55.94 %), broad-leaved forests (*4.85 %), natural grass-
lands (*0.8 %), arable land/permanent crops (*13.64 %), pastures (*8.38 %),
bare rocks (*1.6 %), black marls (*2.86 %), urban fabric (*11.24 %), airdrome
(*0.45 %), water course (*0.21 %), marshes and water bodies (*0.01 %).
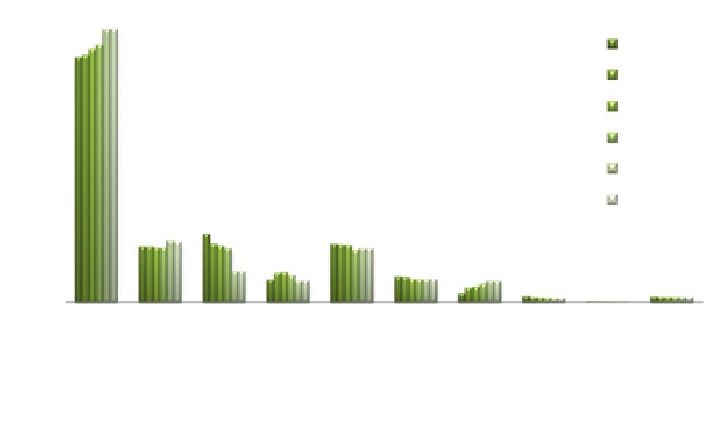
In this study, the evolution of watershed land use was successively studied and
compared using aerial photo interpretation methods and GIS applications. The
results show that the total forest area of the case study region decreased from 46.26
to 51.65 % during the period of 1956-2004, which shows a transformation from
forest to urban areas. Arable land areas decreased from 12.86 to 5.86 %. Con-
versely, urban areas increased from 1.67 to 4.01 %. Later, some parts of these bare
lands which were closer to the city were transformed into urban areas where mass
housing was clearly seen. Figure
6.80
classifies different land use maps according
to aerial photos and Table
6.23
shows statistical results of classification classes
1956, 1974, 1982, 1665, 2000, and 2004.
The period of 1956-2004 shows a huge transformation of arable lands into
other land use types. Arable land has continued to enlarge and be transformed into
urban land. The urban growth rate was *4.01 % and deforestation characterizes
55
50
1956
1974
1982
1995
2000
2004
45
40
35
30
25
20
15
10
5
0
Landuse
Fig. 6.80
Land use changes during 1956-2004


Search WWH ::

Custom Search