Environmental Engineering Reference
In-Depth Information
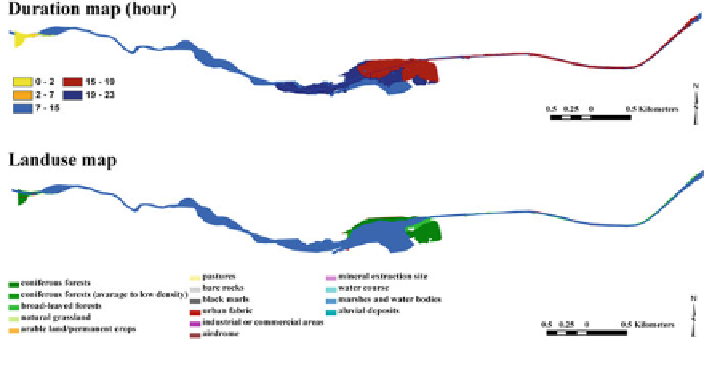
Fig. 6.70
Flood simulation for 100 years return period and affected land use map
The results of velocity and water depth simulations for 100-year return periods
show that the reconstruction of dykes after the 1957 flood event was a good
strategy to protect the area from such a severe flood. In several locations in the
channel on the left and right side of the river, strong overtopping was realized,
matching with the red zones on the PPR map. The idea behind the simulation
represented in Fig.
6.66
was to consider the dyke break implementation in a 100-
year return period.
From Fig.
6.69
, it can be observed that the simulated results with the adoption
of dyke breaks that were shown on the maps for a 100-year return period corre-
sponded with the zone limits delineated by hazard maps by PPR. High zones in the
channel were especially in agreement with the PPR map.
The results of warning time maps for a return period of 100 years are shown in
Fig.
6.70
. This is the minimum time period that people have to be relocated, that
businesses and industries are closed and that transportation in and through the area
might be impossible or hindered. It is an important parameter for assessing the
economic and social impacts of the flood on the people's life and work conditions in
the area. It is also an important parameter for estimating agricultural damage,
because many crops, like fruit bearing trees and vineyards, can withstand inundation
of their stems for a short time (usually some days), but when the length of time
becomes too long the roots will starve from oxygen depletion and the trees will die.
Table
6.19
shows the affected area and type of the land use which were affected
by a flood of a 100-year return period. The areas which were most affected were
coniferous forests, with an area of about 0.18 km
2
that is located in middle part of
the Ubaye River.
With the assumption of a dyke break (Fig.
6.71
) for a 100-year return period,
the affected area is about 2.19 km
2
, of which 49 % belongs to urban area, 21 % to
arable land, and 30 % to coniferous forests (Table
6.20
).
Search WWH ::

Custom Search