Environmental Engineering Reference
In-Depth Information
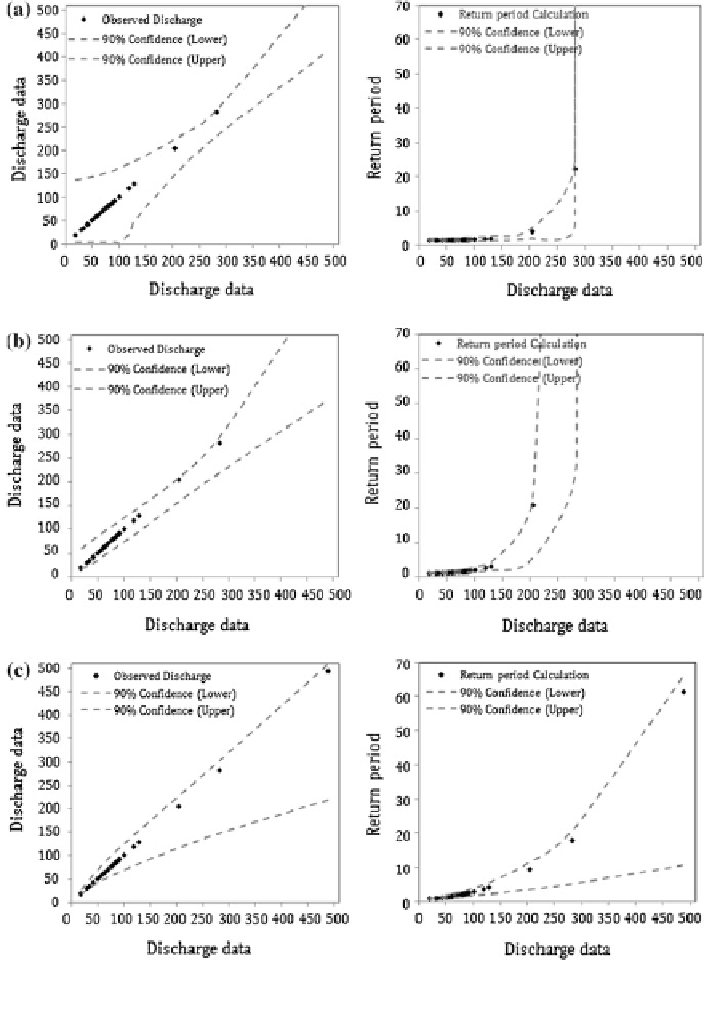
Fig. 6.64 The results of calculated discharge and return period analysis with 90 % confidence
for different methods; a square normal; b normal; c Gumbel
Figure
6.64
a, b, and c shows the calculated discharge and return period analysis
with 90 % confidence in lower and upper parts for the different selected methods.
As shown in Fig.
6.61
a, b, and c, the best fitted results belong to Gumbel methods.
Search WWH ::

Custom Search