Environmental Engineering Reference
In-Depth Information
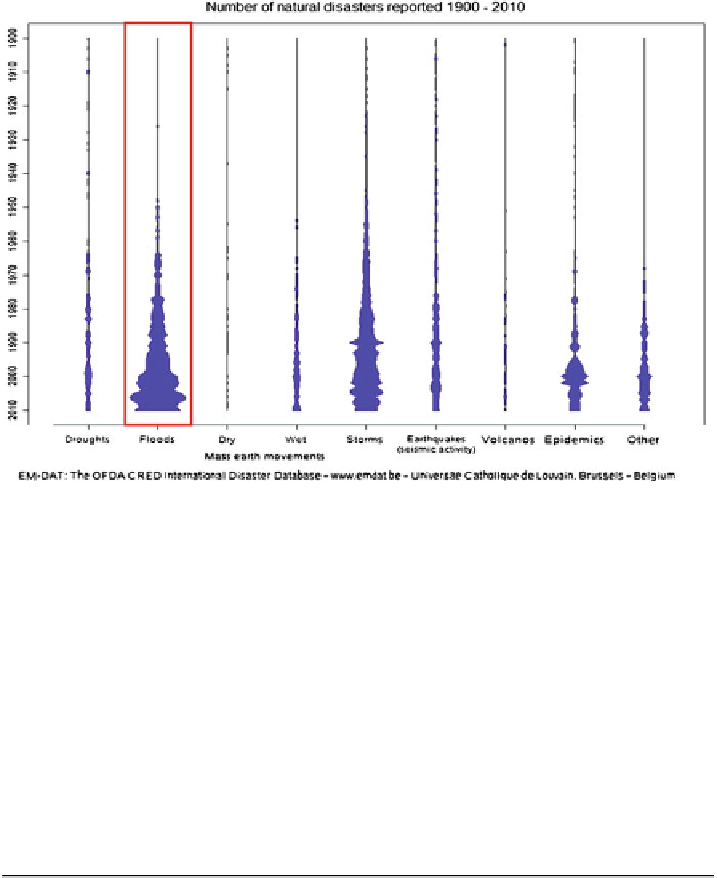
Fig. 1.1 Number of natural disasters reported 1990-2010 [
1
]
Table 1.1 The number of affected people and economic losses [
2
]
No. of events
No. of affected people
Damage (in US$ 1000)
Period
World
World
World
1900-1980
581
407,380,734
2,496,946
1981-1990
546
469,855,416
46,648,071
1991-2000
966
1,463,420,671
233,075,277
2001-2010
1592
874,495,941
141,949,993
Europe
Europe
Europe
1900-1980
53
594,454
658,250
1981-1990
51
839,522
10,482,300
1991-2000
147
4,679,707
41,674,964
2001-2010
209
3,205,507
41,793,882
In comparison to the previous decade (1991-2000), even if the number of affected
people and economic loss both decreased by about 40 % during 2001-2010, the
number of flood events would have still increased by 65 %.
Within the 20 year period from 1991 to 2010, the number of flood events more
than doubled, the number of affected people nearly tripled, and the damage
multiplied by a factor of more than seven in comparison to the 91 year period from
1900 to 1990 (Table
1.1
).

Search WWH ::

Custom Search