Environmental Engineering Reference
In-Depth Information
resolutions, the delineated river networks from 5 m DEM come in close agreement
to the actual flow path. Even in flat urban areas, the results of 5 m resolutions are
more satisfactory compared to 10 m resolutions.
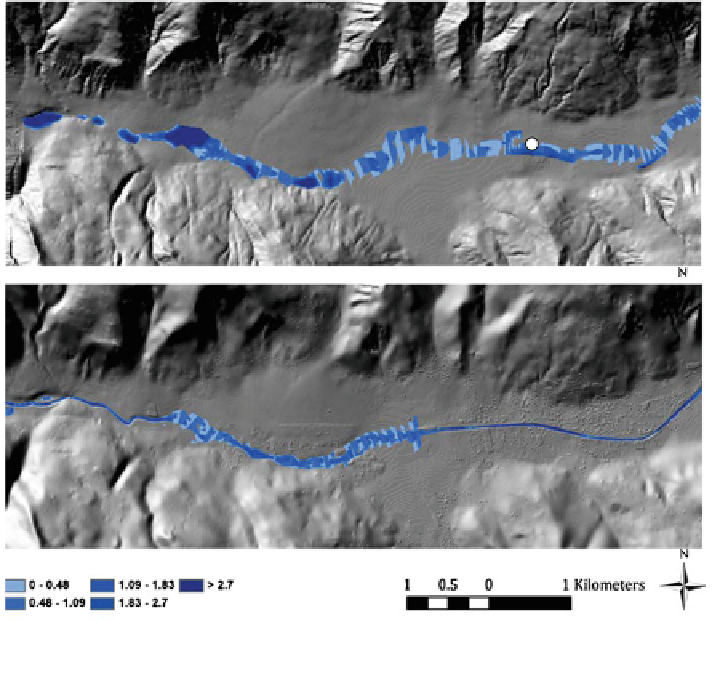
To evaluate the quality of two available DEMs with different resolutions and to
calibrate the models, the recent recorded flood event in May 2008 was considered
as a reference. In the 2008 flood, the water flow remained between the channels
and there was no inundation in the floodplain. The flood event was simulated twice
by models, first with the 5 m resolution DEM and second with the 10 m resolution
DEM. For both simulations, the remaining input data stayed the same. Figure
6.23
shows the simulated maximum flood inundation maps for both models. It can be
observed that the simulated flood for the higher resolution agrees well with the
2008 event, based on recorded field measurements. When applying the 10 m
resolution DEM, the inundation areas were delineated and over topping flow also
occurred. On the contrary, there were no inundated areas in both SOBEK and
HEC-RAS models using the 5 m resolution DEM.
Therefore, it could be concluded that a 5 m resolution DEM shows flood flow
paths more accurately and in more detail in comparison with the 10 m DEM
(a)
(b)
Fig. 6.23 Comparison of flood simulation (depth of water). a DEM with 10 m resolution,
b DEM with 5 m resolution


Search WWH ::

Custom Search