Environmental Engineering Reference
In-Depth Information
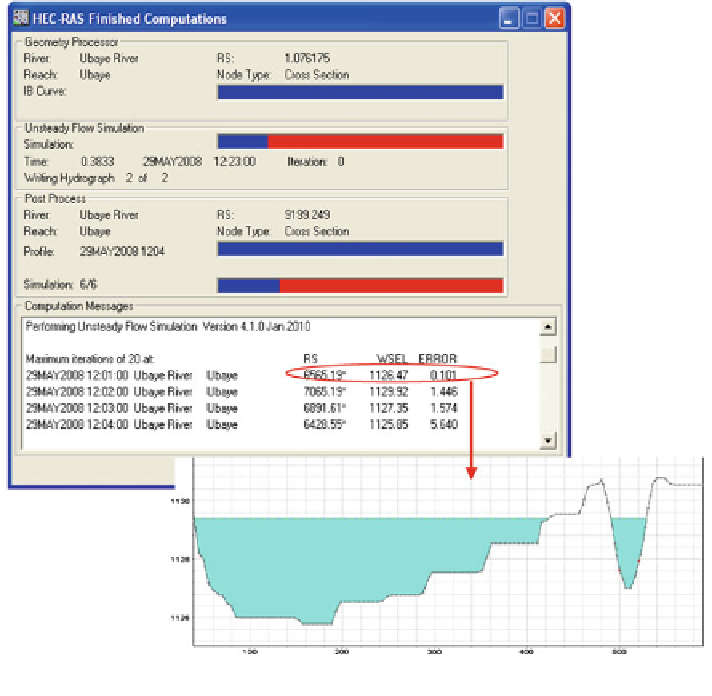
Fig. 6.15
A sample of modeling un-stable due to wrong cross section application
6.6 Discharge Data Modeling
For modeling the discharge value, the rating curve between observed hourly
discharge (m
3
/s) and hourly water height (m) was plotted to calculate the missing
hourly discharge values. The oldest severe flood occurred on 14 May 1957 with a
maximum discharge of 480 m
3
/s and the nearest flood occurred between 29 and 30
May 2008, with a maximum discharge of 205 m
3
/s. Based on the available data, the
modeled discharge values showed maximum discharge of 480, 61.5, 80.47, 129.34,
and 205 m
3
/s for the years of 1957, 1982, 1995, 2000, and 2008, respectively.
Table
6.9
shows the record of maximum discharge of the Ubaye River from
1980 to 2009. But due to the occurrence of an extreme flood event in 1957 and the
availability of the data for this event was considered to estimate flood frequency
analysis.
Search WWH ::

Custom Search