Environmental Engineering Reference
In-Depth Information
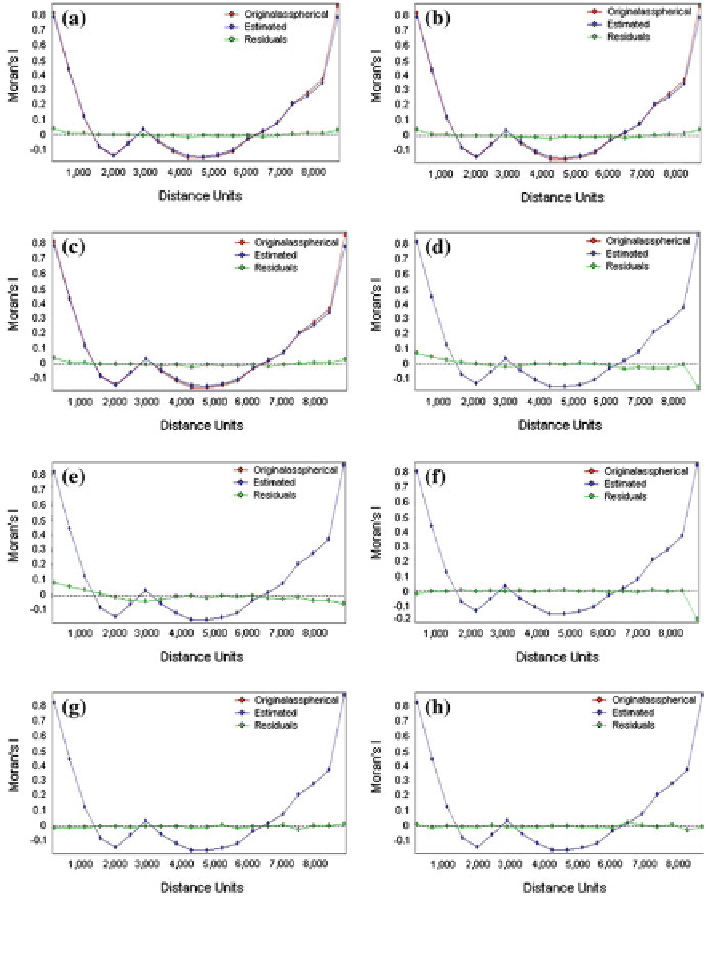
Fig. 6.8 Statistical comparison between original, estimated, and residuals values. a IDW;
b Topo to Raster; c Spline; d Circular; e Exponential; f Gaussian; g Stable; h Spherical
Perhaps the most interesting screens (in terms of what SAM does compare with
most software) are exploring spatial patterns in the model, especially in model
residuals (the green line of the correlogram, with the red representing the source
values and blue representing estimated values) (Fig.
6.8
). The results are shown in
Table
6.6
.
Search WWH ::

Custom Search