Environmental Engineering Reference
In-Depth Information
(a)
(b)
Contour Line
DEM
High : 1772
0 0.050.1 0.2 Kilometers
Low : 1069
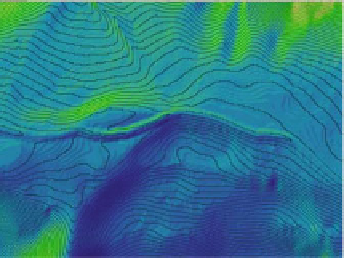
Fig. 6.4
Typical spatial pattern of error. a Modeled DEM. b Original DEM
Table 6.2
Frequency distribution of DEM error
Deterministic
Geostatistic
IDW
Topo
Spline
Circular
Exponential
Gaussian
Stable
Spherical
Mean
-3.55
-3.55
-3.55
-.000
-.003
-.000
-.024
-.000
Max
2.281
2.303
2.27
.000
.003
.000
.055
.000
R square
.972
.972
.972
1.000
1.000
1.000
1.000
1.000
Table 6.3
Standard error and P value of significant level
Variable
Standard coefficient
Standard error
P value
IDW
0.986
0.005
0.000
Topo
0.986
0.005
0.000
Spline
0.986
0.005
0.008
Circular
1
\.001
0.000
Exponential
1
\.001
0.000
Gaussian
1
\.001
0.000
Stable
1
\.001
0.000
Spherical
1
\.001
0.000
methods represent better results comparing to deterministic methods. The standard
error for all Circular, Exponential, Gaussian, Stable, and Spherical is \.001.
For Geostatistic methods, the standard error was about 0, which means that the
spatial distribution of points in applied methods is not too far from the distribution
of original values. When modeling elevation error, it is always assumed that error
is spatially autocorrelated.
This is a reasonable assumption given that the terrain tends to vary smoothly
rather than abruptly, so that the neighboring pixels are likely to have similar height


Search WWH ::

Custom Search