Environmental Engineering Reference
In-Depth Information
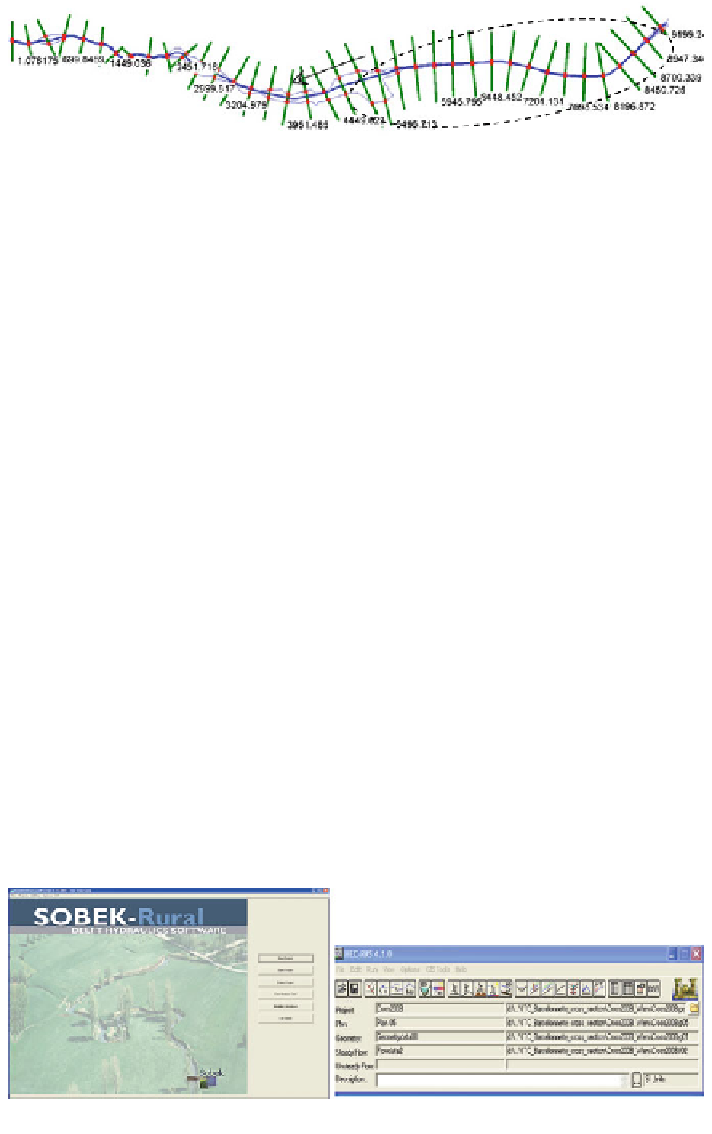
Fig. 3.15
Dyke position parallel to the river in the city part of the river
scenarios (1) and (2): modeling of the flood event in 2008 (with maximum dis-
charge of 205 m
3
/s) with and without the dykes, respectively, supporting scenario
(3): simulation of the flood event in 1957 (with maximum discharge of 480 m
3
/s)
considering the dykes and the scenario (4): modeling of the flood event in 1957
(with maximum discharge of 480 m
3
/s) for the river profile of 2008 considering
the dyke. The Dyke breach case is also performed as the worst situation in the last
scenario. The dyke position was introduced in the DEM using HEC-GeoRAS and
an elevation of 1.5 m (before reconstruction) and 2 m (after reconstruction) were
defined in HEC-RAS for the years of 1957 and 2008, respectively (Fig.
3.15
).
The left and right banks of the Ubaye River in the city area were rebuilt after an
extreme flood in 1957, according to state of the art engineering.
3.10.4 Model Scenario
Different model simulations in the context of modeling results have also been
discussed in many papers [
48
,
93
]. Horritt and Bates [
48
] evaluated the flood
simulation results as obtained from a 1D raster based model and a 2D model with
finite element discretization.
In the model scenario, SOBEK as a 1D-2D model and HEC-RAS as a 1D
model (Fig.
3.16
) were applied in a hydrodynamic simulation to find any advan-
tages and disadvantages of both modeling by comparing the outputs.
Fig. 3.16
Schematic shape of both model
Search WWH ::

Custom Search