Information Technology Reference
In-Depth Information
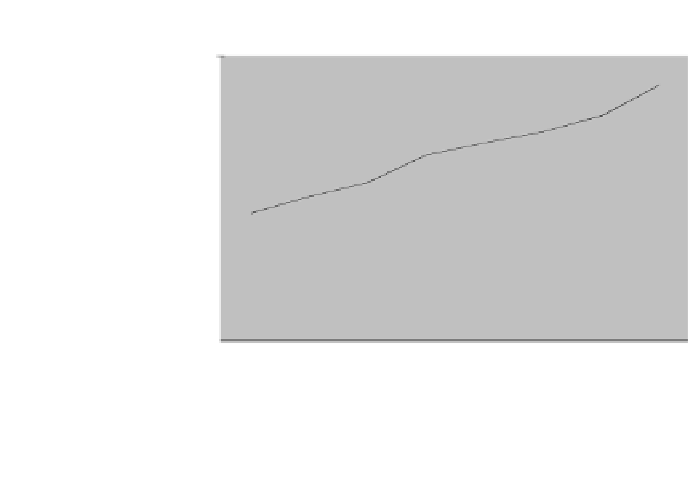
Figure 3-11
Peer Group, PMTUD, and Queue Optimization Statistics
Peer Groups/PMTUD/Queues Comparison
250
200
150
100
50
0
70, 000
80, 000
90, 000
100, 000
110,000
120, 000
130,000
140,000
123
138
148
170
192
202
216
229
Peer Groups Only
102
112
127
125
157
165
165
185
Peer Groups & PMTUD
Peer Groups & Queues
119
121
134
146
163
174
190
202
82
90
114
118
136
153
157
170
Peer Groups, PMTUD, Queues
Prefix Count
Figure 3-12
Baseline and Optimal Pre-Release 12.0(19)S Comparison
Base Line and Optimal Pre-12.0(19)S Configuration Comparison
350
300
250
200
150
100
50
0
70,000
80, 000
90, 000
100, 000
110,000
120, 000
130,000
140,000
Base Line
158
178
195
227
244
256
277
315
Peer Groups, PMTUD, Queues
82
90
114
118
136
153
157
170
Prefix Count


