Environmental Engineering Reference
In-Depth Information
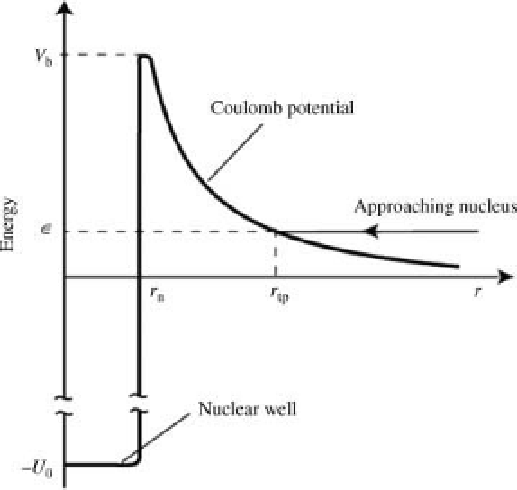
Figure 1.6 Sketch of fusion by tunneling through Coulomb barrier. Even at 15 million K, the
interparticle energy e (kilovolts) is far below the Coulomb barrier V
B
(megavolts). (reproduced from
Ref. [8], Figure 2).
squaresmarked on thismap represent about 0.16%of the earth area and are judged to
be sources of all the worlds power need, about 20 TWestimated for mid-century (see
Figure 1.1), assuming the areas are covered with 10% efficient solar cells [8]. This is
total power consumed, not just electric power!
The units in Figure 1.7b are effective hours of sunlight per year on a
flat plate
collector, including weather effects. The peak value 2100 h per year of sunlight works
out an average W/m
2
value as 2100/(365
240W/m
2
. Note that in
theMidwest portion of theUnited States where the effective hours per year are shown
as around 1600, this corresponds to 1600/365
24) 1000W/m
2
¼
4.4 h per day, at around 1000W/m
2
.
This time span, 4.4 h, is roughly the duration of the peak electric demand, often about
twice the night-time demand.
¼
1.1.2
Secondary Solar-Driven Sources
Wind energy and river
flow energy are indirect results of heating by the sun. Amap of
wind speed in the United States is shown in Figure 1.8. The peak values are in the
range 8
9m/s. The uneven distribution of the resource makes clear the need for a
wide grid network or for conversion to a fuel such as hydrogen that could be piped or
shipped in containers.
-
1.1.2.1 Flow Energy
The power that can be derived from wind or water
flow is proportional to v
3
.To
understand this result, consider an area A
¼p
R
2
oriented perpendicular to a
ow at