Environmental Engineering Reference
In-Depth Information
10.5
Comparison of Solar Power versus Wind Power
A simple analysis of the cost of establishing about 500 GWof continuous power from
photovoltaics indicates that a solar farm around 150 miles on a side and costs
(neglecting the land) for the production lines and cell production of about $ 0.845
trillion would be needed. In Chapter 1, a similar analysis for wind turbines required a
land area about 230 miles on a side and a capital cost about $ 0.5 trillion. We noted
there that the cost would be similar to 7% of the U.S. military budget over a period of
10 years. In neither case were the costs associated with storage and transmission of
energy taken into account. In both cases, storage and transmission of energy could be
envisioned by production of hydrogen from water, with the hydrogen used as the
portable form of energy. (The primary form of storage in the U.S. power grid is
pumped hydroelectric power, with capacity about 21 GWat present (http://www.esd
.ornl.gov/WindWaterPower/PSHSummit.pdf) with worldwide capacity 127 GW.)
The great dif
culties with these energy sources are the diffuse nature of the energy
available, requiring extremely large collection areas, and the variability of the
resulting power output. The advantage of the wind turbines is that the wind keeps
blowing at night, while solar power is unavailable. The basic daily variation of the
photovoltaic power output can be used to advantage, however, if the renewable power
is derived from nearly equal amounts of wind and solar energy. The variation in
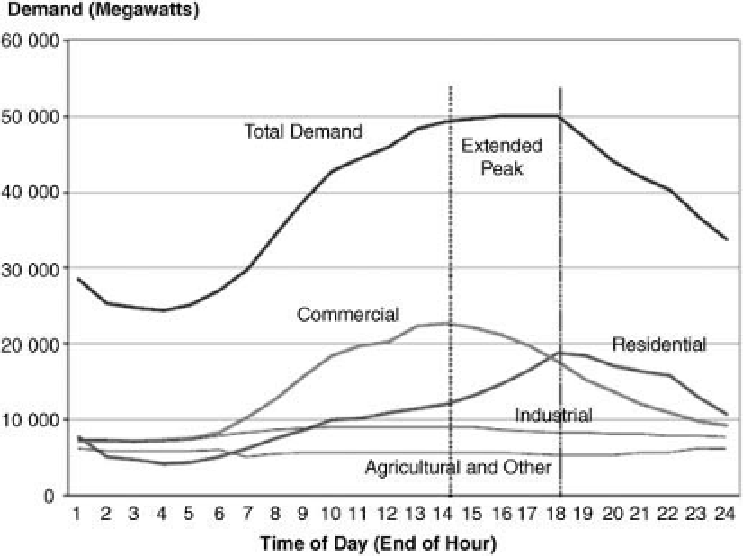
Figure 10.5 The total load profile (http://www.mpoweruk.com/electricity_demand.htm (Data
from Lawrence Berkeley National Laboratory, U.S. Dept. of Energy)) for the State of California on a
hot day in 1999. The demand during the day is about twice the demand at night.