Environmental Engineering Reference
In-Depth Information
windpower, geothermal power, wave and tidal power, are too small to be seen on the
same scales.
Energy can be expressed as power times time, one kWh (kilowatt hour) is
1000
10
6
J
10
6
Ws. The BTU, British thermal unit,
3600
¼
3.6
¼
3.6
is
10
18
J. It is stated
below that the U.S. energy consumption was 94.82 Quads in 2009. In terms of
average power, since a year is 365
10
15
BTU is thus 1.054
1054 J, and the less familiar Quad
¼
10
7
s, this 3.17 TW. (This
amounts to about 21.6% of global power, while one may note that U.S. population of
311 million is only 4.4% of the global population at 7 billion).
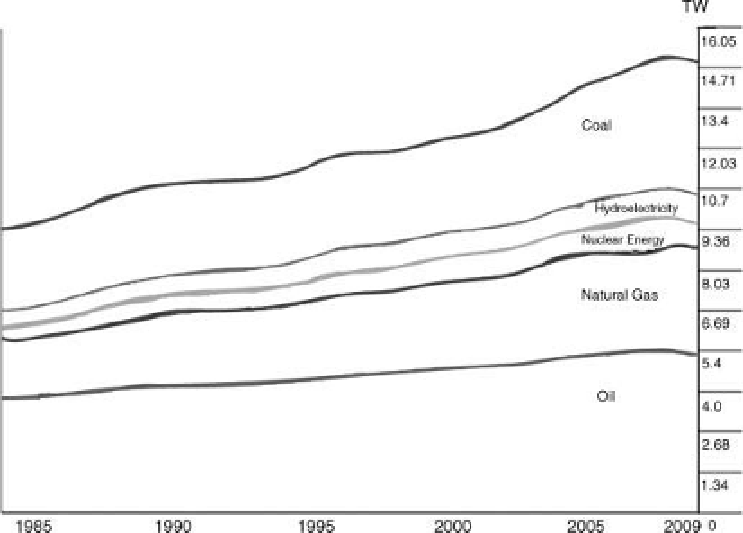
According to the BP Statistical Review of World Energy June 2010, the worlds
equivalent total power consumption in 2008was 14.7 TW(see Figure 1.1). The largest
sources in order are oil, coal, and natural gas, with hydroelectric accounting for
1.1 TWand nuclear about 0.7 TW, about 7.3 and 4.5%, respectively. Renewable power
such as solar andwind are not tabulated by BP, but are clearly almost negligible on the
present scale of fossil fuel power consumptions.
More details of the 2009 power consumption in the United States, breaking out the
renewable energy portions, are shown in Figure 1.2.
Although the renewable energy portions are at present small, they are clearly in
rapid growth. To get an idea of the growth, we
24
3600 s
¼
3.15
find from reasonable sources
Figure 1.1 Global consumed power (based on
BP Statistical Review of World Energy June
2010). The smallest band is nuclear, about
0.66 TW, and next smallest is hydroelectric,
about 1.07 TW. (This is also referred to as TPES,
total primary energy supply.) The largest in order
are oil, coal, and natural gas, accounting for
about 88.2% of all energy consumption. Astute
observers agree that the three leading sources
shown here are likely to significantly decrease in
the next century, as prices rise due to depletion
of easily available sources.