Environmental Engineering Reference
In-Depth Information
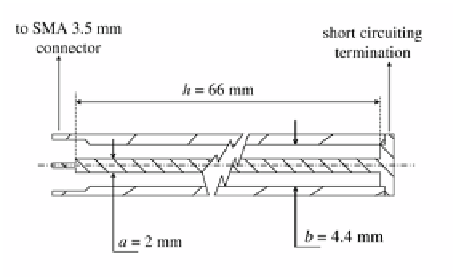
The probe was short-circuited at the distal end; the schematic configuration of
the probe is shown in Fig. 4.12.
Fig. 4.12
Schematic config-
uration of the used coaxial
probe.
The TL model of the measurement cell was implemented in the MWO simulator.
The basic TL model includes a length of short-circuited coaxial probe, with the
physical dimensions of the actual probe, filled with a material characterized through
its relative permittivity and loss tangent (whose frequency-dependent variation is
described by (2.38)).
Preliminary TDR measurements on well-referenced materials showed that two
major parasitic effects were apparent in the acquired waveforms: one is caused by
the transition probe/SMA connector, whereas the other is due to the non-ideality
of the short circuit at the end of the probe. Therefore, to take into account these
parasitics, the TL model was appropriately adjusted; in particular, the introduction
of some lumped circuit elements appropriately resembled the contributions noticed
in the actual measurements.
In order to obtain a TL model where the only variable parameters would be the
Cole-Cole parameters of the LUT, the first step was the optimization of the model
(i.e., the individuation of the values of the added lumped elements). For this pur-
pose, preliminary measurements were carried out on three well-referenced mate-
rials, namely 1,1,1-trichloroethane, ethyl acetate, and air: for these materials, the
Cole-Cole parameters were taken from the related literature [3] and were consid-
ered as known values. Through an optimization procedure detailed in Sect. 4.3.1,
the squared deviations between the measured
S
11
(
)
were minimized, thus estimating the values of the lumped elements that appropri-
ately described the parasitics of the measurement cell.
Minimization was performed over a frequency range
3
that goes up to 4 GHz. As
an example, Fig. 4.13 shows the comparison between the measured
S
11
(
f
)
and the modeled
S
11
,
MOD
(
f
f
)
and the
3
Preliminary minimization routines were performed over different frequency ranges, and
the 0-4 GHz frequency range proved the optimal frequency range both in terms of mini-
mum of the objective function of the minimization and in terms of appropriateness of the
optimized circuit elements.


Search WWH ::

Custom Search