Environmental Engineering Reference
In-Depth Information
1.2
1.0
0.8
0.6
0.4
FFT
Optimi
z
ation
0.2
0.0
0.0
0.1
0.2
0.3
0.4
0.5
0.6
0.7
f
(GHz)
(a)
180
135
90
45
0
-45
-90
-135
FFT
Op
t
imizati
o
n
-180
0.0
0.1
0.2
0.3
0.4
0.5
0.6
0.7
f
(GHz)
(b)
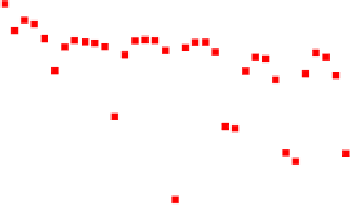
Fig. 4.10
Reflection scattering parameter for sample #1 as obtained from FFT of TDR mea-
surements and evaluated through the optimization procedure.
a
magnitude.
b
phase
for sensing small deviations from the standard reference status, even when they are
caused by the temperature variations.
As an example, Fig. 4.9 and Fig. 4.10 compare the optimized
S
11
(
for sam-
ple #1, with measurements obtained from VNA and from the TD/FD combined
approach, respectively.
It is worth noting that, although the
S
11
f
)
(
)
directly obtained from VNA mea-
surements, as expected, appears to be less noisy than the
S
11
f
(
)
obtained from the
TD/FD combined approach, this does not have any relevant impact on the accuracy
in the evaluation of quantitative and dielectric parameters.
f


Search WWH ::

Custom Search