Environmental Engineering Reference
In-Depth Information
[4]. The reflected signal is acquired by the oscilloscope, and its voltage amplitude is
displayed as a function of time (or as a function of the traveled electric distance).
The ratio between the amplitude of the reflected signal,
v
refl
(
t
)
, and the amplitude
of the generated signal,
v
inc
(
t
)
, gives the value of the reflection coefficient in time
ρ
(
)
domain,
t
[10]:
(
)
v
refl
t
ρ
(
t
)=
(3.1)
v
inc
(
t
)
where
1.
It is important to point out that, most often, the oscilloscope functionality is in-
tegrated with the signal generator within one single instrument (which, as will be
detailed later in this chapter, can be either portable or benchtop).
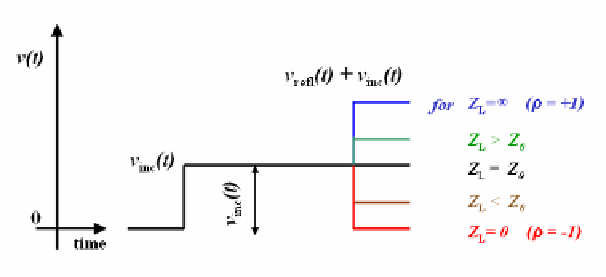
Clearly, the behavior of
−
1
≤
ρ
(
t
)
≤
+
is strictly associated with the impedance variations
along the electrical path traveled by the electromagnetic (EM) signal. As an exam-
ple, Fig. 3.2 shows the schematization of the TDR waveforms observed when the
SUT exhibits purely-resistive behavior.
If an increase of impedance is encountered (i.e.,
Z
L
>
ρ
(
t
)
Z
0
), then a positive step
is observed and the reflection coefficient will be positive. Conversely, if a decrease
of impedance is encountered (i.e.,
Z
L
<
Z
0
), then a negative step is observed and
the reflection coefficient will be negative. In particular, if the impedance of the load
equals the characteristic impedance of the line (i.e.,
Z
L
=
Z
0
), no wave will be re-
flected (
0); hence, the TDR display on the scope is a flat line. If an open circuit
is encountered, then the reflected voltage will equal the generated voltage and the
reflection coefficient will be +1. If a short circuit is encountered, the reflection co-
efficient will be -1. It goes without saying that the actual value of an 'unknown'
Z
L
may be inferred from the reflection coefficient displayed by the TDR unit.
Also of interest are the reflections produced by complex load impedances. Four
basic examples of these reflections are shown in Fig. 3.3, where the incident step
voltage is indicated as
E
i
. A direct analysis (in TD) of the reported waveforms in-
volves evaluating the reflected voltage at
t
ρ
=
=
0andat
t
=
∞
, and assuming any
transition between these two values to be exponential.
Fig. 3.2
Schematization of TDR waveforms for purely-resistive terminations


Search WWH ::

Custom Search