Environmental Engineering Reference
In-Depth Information
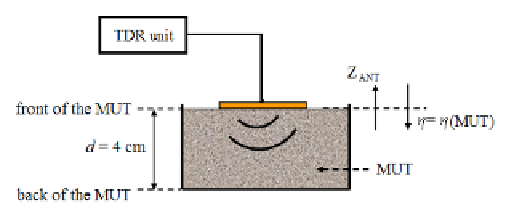
Fig. 5.15
Schematic diagram of the experimental setup used for the noninvasive measure-
ments [12]
•
the
S
11
(
is used to evaluate the resonant frequency of the system (occurring at
the minimum of the
S
11
(
f
)
f
)
curve); and finally,
•
the evaluated
f
res
is associated to the moisture level of the sample.
As well known, changes in the resonant frequency of the antenna could be directly
determined through a vector network analyzer (VNA). However, as already men-
tioned, using a TDR instrument in place of a VNA can reduce the costs related
to the experimental setup. In this regard, as also mentioned in previous cases, al-
though the reported results were obtained through the TDR80E04 [61], a benchtop
and expensive instrument, the proposed method can be equally implemented using
affordable TDR instruments.
5.6.1
Basic Theory of Microstrip Antennas
Before proceeding with the detailed description of the experimental procedure,
in this subsection the basic theoretical aspects behind the proposed method are
addressed.
A microstrip antenna consists of a dielectric substrate with a radiating patch on
one side and a ground plane on the other side [see Fig.s 5.16(a) and 5.16(b)]. This
kind of antennas is inexpensive to be fabricated, and a high level of reproducibil-
ity can be achieved. As well known, an antenna is characterized by its resonant
frequency, which is defined by the following equation [37]:
c
2
L
eff
√
ε
eff
=
f
res
(5.33)
where
c
=
10
8
ms
−
1
is the speed of light in free space,
L
eff
is the effective length
of the radiating patch, and
3
×
ε
eff
is the effective relative permittivity of the antenna.
L
eff
and
ε
eff
can be evaluated considering the following equations:
2
h
√
ε
eff
L
eff
=
L
+
2
Δ
L
=
L
+
(5.34)


Search WWH ::

Custom Search