Information Technology Reference
In-Depth Information
100
90
80
70
HASP50
HASP250
60
50
40
30
20
10
0
0
25
50
75
100
125
150
175
200
225
250
275
300
Number of generations
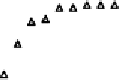
Figure 12.13.
Variation of success rate with evolutionary time for healthy and
strong populations of 50 (HASP50) and 250 individuals (HASP250). The success
rate was evaluated over 100 identical runs.
Table 12.6
Sources of genetic variation used in healthy and strong populations
(
HASP
) and homogenizing populations (
HP
).
HASP
HP
Number of runs
100
100
Number of fitness cases
10
10
Function set
+ - * /
+ - * /
Head length
7
7
Number of genes
5
5
Linking function
+
+
Chromosome length
75
75
Mutation rate
0.044
--
One-point recombination rate
0.3
1.0
Two-point recombination rate
0.3
1.0
Gene recombination rate
0.1
1.0
IS transposition rate
0.1
--
IS elements length
1,2,3
--
RIS transposition rate
0.1
--
RIS elements length
1,2,3
--
Gene transposition rate
0.1
--
Selection range
25%
25%
Precision
0%
0%