Information Technology Reference
In-Depth Information
100
90
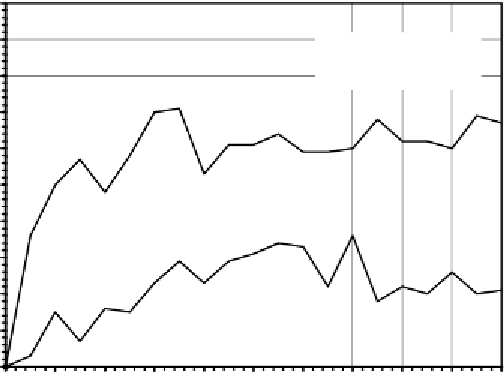
Gene Del/Ins
80
Seq Del/Ins
70
60
50
40
30
20
10
0
0.0
0.1
0.2
0.3
0.4
0.5
0.6
0.7
0.8
0.9
1.0
Deletion/Insertion rate
Figure 11.4.
Comparison of gene deletion/insertion with sequence deletion/
insertion on the traveling salesperson problem with 13 cities. For this analysis,
P
= 100 and
G
= 200. The success rate was evaluated over 100 identical runs.
chromosomes modified. A more generalized version of this operator can be
easily implemented where a different number of genes in a chromosome can
trade places with other genes according to a certain rate. More formally, the
generalized permutation rate
p
gp
is evaluated by , where
N
G
represents the number of genes modified and
C
L
the chromosome length.
Again, this might appear more efficient than the restricted permutation de-
scribed in section 11.2.3, but experience shows that restricted permutation is
slightly better (see Figure 11.5 below). For instance, in the TSP with 19
cities (see Figure 11.3 above), generalized permutation performed worse than
restricted permutation and, in fact, was incapable of finding a perfect solu-
tion to this problem.
The results obtained for a simpler version of the TSP with 13 cities are
shown in Figure 11.5. In this analysis, both the restricted permutation and
generalized permutation operators are compared using populations of 100
individuals evolving for 200 generations, that is, exactly the same values of
P
and
G
used to solve the much more complex TSP with 19 cities shown in
Figure 11.3.
(
)
p
=
N
C
⋅
P
gp
G
L