Information Technology Reference
In-Depth Information
The expression of the best individual of this population (chromosome 15)
and the corresponding mathematical expression are shown in Figure 6.3.
Note that both ADFs are used twice in the active cell, resulting in a program
considerably more complex than the basic building blocks that it uses, al-
though, as we will see next, not necessarily fitter.
This model has a fitness of 46.24757 and an R-square of 0.02292 evalu-
ated against the training set and, as you can see by plotting both the target
and predicted values (Figure 6.4), this model is indeed a very rough approxi-
mation to the target function (6.1).
a.
01234560123
*aa++aaaaaa-**/+aaaaaa+0*-11010
01234560123012345601012345601
**-011010
b.
ADF
0
ADF
1
a
a
a
a
/
a
a
a
a
c.
Cell
0
Cell
1
ADF
0
ADF
1
ADF
0
ADF
1
ADF
1
ADF
0
ADF
1
ADF
0
2
2
2
2
6
5
4
y
(
a
)
(
2
a
a
)
[
(
2
a
a
)
(
a
)
]
2
a
6
a
4
a
d.
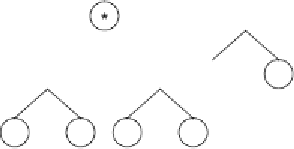
Figure 6.3.
Best individual of generation 0 (chromosome 15). It has a fitness of
46.24757 evaluated against the set of fitness cases presented in Table 6.1.
a)
The
chromosome of the individual with the best cell shown in bold.
b)
The ADFs
codified by each gene.
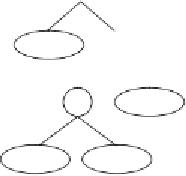
c)
The cells or main programs encoded in the homeotic
genes (the best cell is highlighted).
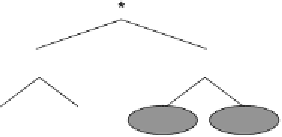
d)
The mathematical expression encoded in the
best cell (the contribution of each ADF is shown in parentheses).