Environmental Engineering Reference
In-Depth Information
70
70
f
g
f
g
f
f
60
60
50
50
40
40
30
30
0
2
4
6
8
10
0
2
4
6
8
10
Time [s]
Time [s]
(a) Frequency tracking
45
45
v
m
v
m
E
E
35
35
25
25
15
15
0
2
4
6
8
10
0
2
4
6
8
10
Time [s]
Time [s]
(b) Amplitude tracking
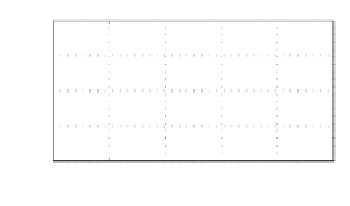
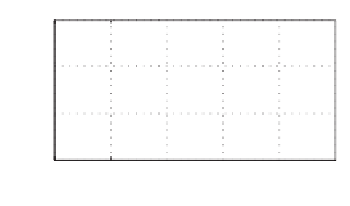
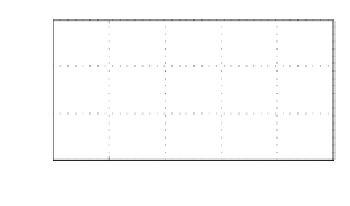
Figure 22.12
Frequency and amplitude tracking for a distorted noisy signal with a variable frequency:
Experimental results with the SOGI-PLL (left column) and with the STA (right column)
22.8.2 With a Noisy Distorted Signal having a Variable Frequency
The voltage signal used in Section 22.7.1 was generated and sent out via a DAC channel as
the voltage signal
. The experiment was carried out for the SOGI-PLL and the STA and
the results are shown in Figure 22.12. The experimental results matched very well with the
simulation results shown in Figure 22.8. The SOGI-PLL was able to track the frequency and
the amplitude but with much bigger ripples in the amplitude. The frequency produced by the
STA varied in a wide range. The experimental results when the frequency changed from 40 to
50 Hz are shown in Figure 22.13. The SOGI-PLL tracked the frequency well but there were
noticeable variations in the frequency after the change. The STA was not able to deal with the
change in the frequency.
v
22.8.3 With a Noisy Distorted Square Wave
The voltage signal used in Section 22.7.2 was generated and sent out via a DAC channel as
the voltage signal
. The experiment was carried out for the SOGI-PLL and the STA and the
results are shown in Figure 22.14. The experimental results matched the simulation results.
The STA was not able to track the amplitude and the frequency although the phase was tracked
well. The voltages recovered contain significant harmonics.
v


Search WWH ::

Custom Search