Environmental Engineering Reference
In-Depth Information
70
70
f
g
f
g
f
f
60
60
50
50
40
40
30
30
0
1
2
3
4
5
6
7
8
9
10
0
1
2
3
4
5
6
7
8
9
10
Time [s]
Time [s]
(a) Frequency
45
45
v
m
v
m
E
E
35
35
25
25
15
15
0
1
2
3
4
5
6
7
8
9
10
0
1
2
3
4
5
6
7
8
9
10
Time [s]
Time [s]
(b) Amplitude of the fundamental component
60
60
v−v
h
v−v
h
e
e
40
40
20
20
0
0
−20
−20
−40
−40
7.98
8.02
8.06
8.1
8.14
8.18
7.98
8.02
8.06
8.1
8.14
8.18
Time [s]
Time [s]
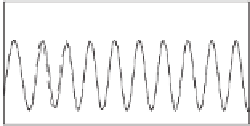
(c) Tracking the fundamental component when
jumped from 40 Hz to 50 Hz
5
5
4
4
3
3
2
2
1
1
0
0
8.9
8.94
8.98
9.02
9.06
9.1
8.9
8.94
8.98
9.02
9.06
9.1
Time [s]
Time [s]
(d) THD of the recovered fundamental component
when
is around 50 Hz
8
8
θ
g
θ
g
θ
θ
6
6
4
4
2
2
0
0
7.98
8.02
8.06
8.1
8.14
8.18
7.98
8.02
8.06
8.1
8.14
8.18
Time [s]
Time [s]
(e) Tracking the phase of the fundamental component when
jumped from 40 Hz to 50 Hz
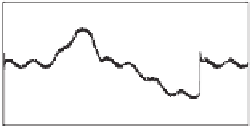
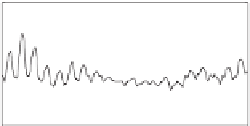
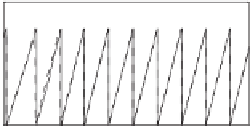
Figure 22.8
Tracking a distorted noisy signal with a variable frequency: Simulation results with the
SOGI-PLL (left column) and with the STA (right column)


















Search WWH ::

Custom Search