Environmental Engineering Reference
In-Depth Information
2
2
Q
1
Q
2
Q
1
Q
2
1
1
0
0
−1
−1
−2
−2
0
1
2
3
4
5
6
7
8
9
10
11
12
0
1
2
3
4
5
6
7
8
9
10
11
12
Time [s]
Time [s]
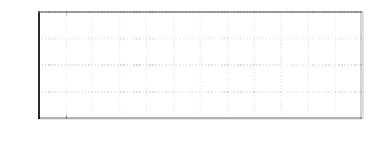
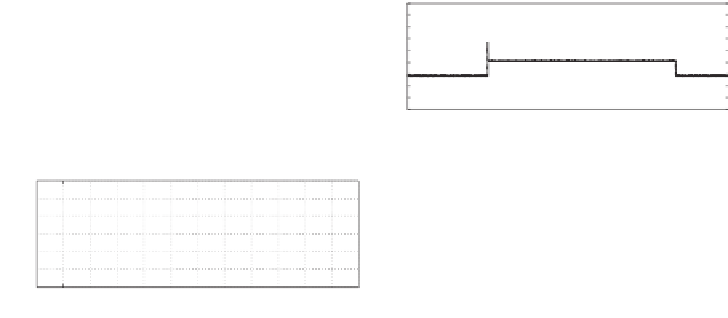
(a) Reactive power
24
24
P
1
P
2
P
1
P
2
20
20
16
16
12
12
8
8
4
4
0
0
−4
−4
0
1
2
3
4
5
6
7
8
9
10
11
12
0
1
2
3
4
5
6
7
8
9
10
11
12
Time [s]
Time [s]
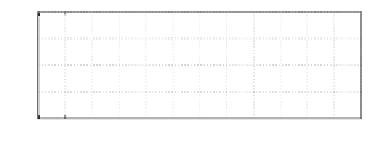
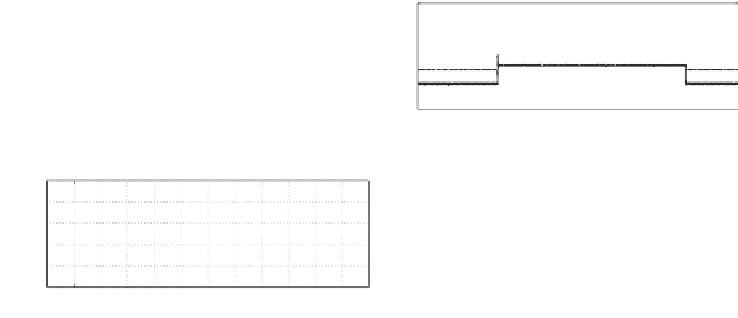
(b) Real power
18
18
1
16
V
o1
V
o2
1
16
V
o1
V
o2
1
12
1
12
8
8
4
4
0
0
0
1
2
3
4
5
6
7
8
9
10
11
12
0
1
2
3
4
5
6
7
8
9
10
11
12
Time [s]
Time [s]
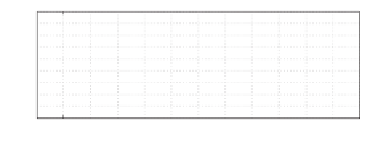
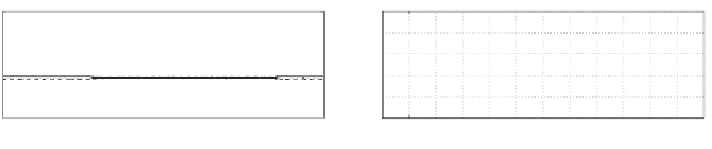
(c) RMS value of the load voltage
24
24
E
1
E
2
E
1
E
2
20
20
16
16
12
12
8
8
4
4
0
0
0
1
2
3
4
5
6
7
8
9
10
11
12
0
1
2
3
4
5
6
7
8
9
10
11
12
Time [s]
Time [s]
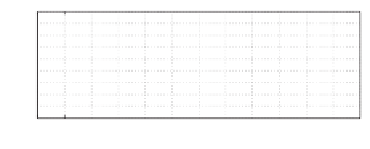
(d) Voltage set-point
50.6
50.6
f
1
f
2
f
1
f
2
50.4
50.4
50.2
50.2
50
50
49.8
49.8
49.6
49.6
0
1
2
3
4
5
6
7
8
9
10
11
12
0
1
2
3
4
5
6
7
8
9
10
11
12
Time [s]
Time [s]
(e) Frequency
4
4
i
1
i
2
i
1
i
2
2
2
0
0
−2
−2
−4
−4
7
7.01
7.02
7.03
7.04
7.05
7.06
7
7.01
7.02
7.03
7.04
7.05
7.06
Time [s]
Time [s]
(f) Current in the steady state
Figure 19.9
Experimental results for the case with a linear load when inverters have the same per-
unit output impedance: with the robust droop controller (left column) and with the conventional droop
controller (right column)


Search WWH ::

Custom Search