Environmental Engineering Reference
In-Depth Information
50.3
20
f
f
g
15
50.2
10
50.1
5
50
0
−5
49.9
−10
49.8
−15
49.7
−20
0
5
10
15
20
25
30
0
5
10
15
20
25
30
Time [s]
Time [s]
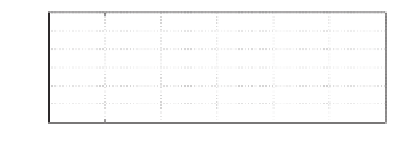
(a) Synchronverter and grid frequencies
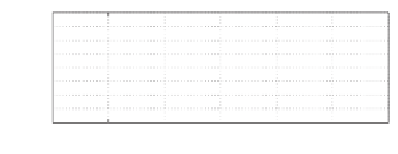
(b) Voltage difference
25
100
v
v
g
P
Q
80
20
60
15
40
20
10
0
5
−20
0
−40
0
5
10
15
20
25
30
0
5
10
15
20
25
30
Time [s]
Time [s]
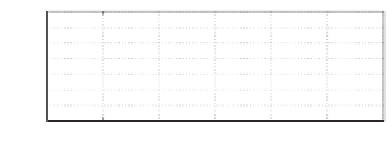
(c) Amplitude of
and
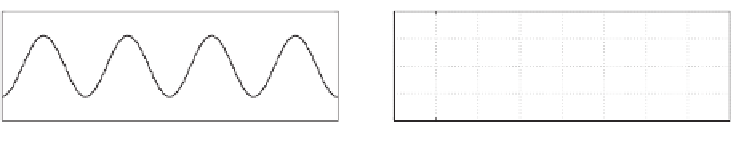
(d)
and
Figure 18.7
Experimental results: when the grid frequency was higher than 50 Hz
uncontrolled rectifier loaded with an LC filter
L
=
150
μ
H,
C
=
1000
μ
F and a resistor
R
=
20
, and an unbalanced resistive load with
R
A
=
R
C
=
12
and
R
B
=∞
.
18.5.2.1 With a Balanced Linear Load
The results are shown in Figure 18.8. The output voltage was very clean and was main-
tained well.
30
4
u
A
i
A
15
2
0
0
−15
−2
−30
−4
0
0.01
0.02
0.03
0.04
0.05
0.06
0.07
0.08
0
0.01
0.02
0.03
0.04
0.05
0.06
0.07
0.08
Time [s]
Time [s]
(a) Local load voltage
(b) Local load current
5
5
THD of i
A
=0.27%
THD of u
A
=0.28%
4
4
3
3
2
2
1
1
0
0
0
5
10
15
20
25
30
0
5
10
15
20
25
30
Harmonics order
Harmonics order
(c) Spectra of the local load voltage
(d) Spectra of the local load current
Figure 18.8
Loading performance in the stand-alone mode with a linear load


Search WWH ::

Custom Search