Environmental Engineering Reference
In-Depth Information
50.3
20
f
f
g
15
50.2
10
50.1
5
50
0
−5
49.9
−10
49.8
−15
49.7
−20
0
5
10
15
20
25
30
0
5
10
15
20
25
30
Time [s]
Time [s]
(b) Voltage difference
(a) Synchronverter and grid frequencies
25
100
v
v
g
P
Q
80
20
60
15
40
20
10
0
5
−20
0
−40
0
5
10
15
20
25
30
0
5
10
15
20
25
30
Time [s]
Time [s]
(c) Amplitude of
and
(d)
and
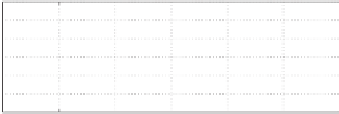
Figure 18.6
Experimental results: when the grid frequency was lower than 50 Hz
caused the frequency to respond with a big spike; the synchronverter initially “stored” some
reactive power but then released it very quickly. After the reactive power demand was raised,
it took less than 10 cycles to reach the setpoint with a small overshoot, as shown in Figure
18.6(d). The frequency dropped slightly and the real power increased a bit, but all returned
to normal very quickly. Because the droop mechanism was not enabled, the real power and
reactive power delivered by the synchronverter followed the reference values without any error.
After the droop mechanism was enabled, roughly at
t
26 s, the synchronverter responded
to the deviations of the grid frequency and the voltage from their nominal values. The real
power delivered was increased because the grid frequency was lower than the nominal value,
while the reactive power was decreased because the local terminal voltage was higher than the
nominal value.
=
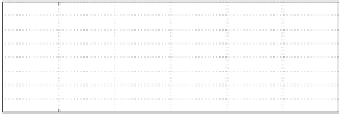
18.5.1.2 With a Grid Frequency Higher than 50 Hz
During this experiment, the grid frequency was higher than 50 Hz, as shown in Figure 18.7.
There was not much difference from the previous experiment before the droop mechanismwas
enabled and the synchronverter responded well to the instructions. After the droop mechanism
was enabled, roughly at
t
26 s, the synchronverter started responding to the grid frequency,
which was higher than the nominal value, and dropped the real power output by 10 W to 60 W.
The reactive power delivered was decreased because the local terminal voltage was higher
than the nominal value.
=
18.5.2 Loading Performance in the Stand-alone Mode
Experiments were carried out in the stand-alone mode to test the loading performance of the
sychronverter, under a balanced resistive load with
R
A
=
R
B
=
R
C
=
12
, a three-phase


Search WWH ::

Custom Search