Environmental Engineering Reference
In-Depth Information
u
f
v
o
-
1
Z
c
(
s
)
sL
i
e
−
Ts
s
-
K
i
K
R
(
s
)
-
u
v
r
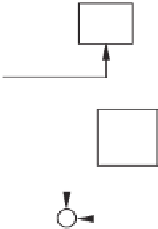
Figure 8.6
Approximate block diagram of the complete system
There are various ways to approximate the effect of sampling, computation and PWM
conversion. One of them is to use a one-step delay
e
−
T
s
s
, where
T
s
is the sampling period.
With this approximation, the complete system block diagram is shown in Figure 8.6 and the
characteristic equation of the closed-loop system is
K
i
+
K
R
(
s
)
Z
c
(
s
)
sL
e
−
T
s
s
1
+
=
0
,
+
Z
c
(
s
)
or, equivalently,
K
i
e
−
T
s
s
K
R
(
s
)
e
−
T
s
s
)
Z
c
(
s
)
sL
+
+
(1
+
=
0
.
1
It is the same as that of the system with the open-loop transfer function of
sL
+
K
i
e
−
T
s
s
(1
+
K
R
(
s
)
e
−
T
s
s
)
Z
c
(
s
). The terms
Z
c
(
s
) and 1
K
R
(
s
)
e
−
T
s
s
+
remain stable under the aforemen-
1
sL
+
K
i
e
−
T
s
s
is no longer stable for very large
K
i
. In order
tioned conditions. However, the term
1
to make sure that
K
i
e
−
T
s
s
is stable, the gain
K
i
should satisfy
sL
+
K
i
<
2
L
T
s
.
(8.6)
This is consistent with (7.2) and clearly shows that there is an upper bound on the current
feedback gain
K
i
. The gain
K
i
should be further decreased if a low-pass filter is involved in
the measurement of the current because the filter introduces extra phase lag.
8.4 Experimental Results
This control strategy can be combined with other strategies, e.g. the robust droop control for
parallel operation of inverters discussed in Chapter 19. Extensive experimental results with the
combined strategy to achieve accurate power sharing, tight voltage regulation and low voltage
THD are presented in Chapter 20.


Search WWH ::

Custom Search