Environmental Engineering Reference
In-Depth Information
4.5.1 Nominal Responses
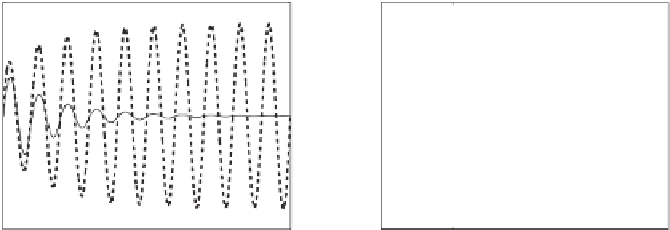
Two simulations were conducted to assess the steady-state tracking performance of the system
with the nominal load, with no disturbance current and an undistorted grid. The nominal load
is shown in Figure 4.1, with the values of the components given in Table 4.1.
The first simulation was conducted with the PWM block and the inverter modelled as a
simple saturated unity gain with saturation levels of
425 V, as described in
Section 4.2. The output voltage and the tracking error are shown in Figure 4.7(a), which
demonstrates that the tracking error was reduced to very small after approximately 5 mains
cycles. The steady-state error, which is about 0
±
V
DC
/
2
=±
15 V(peak), is shown in Figure 4.7(c). The
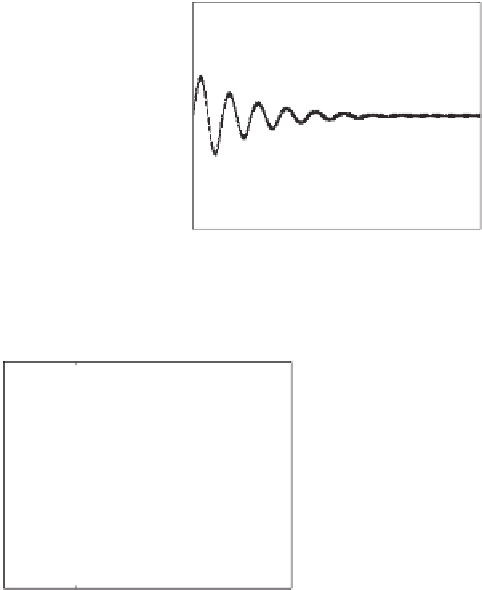
second simulation used a detailed inverter model including a PWM block with a switching
frequency of 10 kHz. The response is shown in Figure 4.7(b). The results are similar but
there are switching noises present, which increases the steady-state tracking error to approx-
imately 7 V (peak), as shown in Figure 4.7(c). The controller was not able to suppress the
switching noises, because it could only update the input to the pulse-width modulator once
.
400
400
u
o
u
o
e
e
300
300
200
200
100
100
0
0
−100
−100
−200
−200
−300
−300
−400
−400
0
0.05
0.1
0.15
0.2
0
0.05
0.1
0.15
0.2
Time (sec)
Time (sec)
(a) With the PWM block and the inverter
modelled as a simple saturation
(b) With a detailed model of the PWM
block and the inverter (
f
s
=10
kHz)
10
8
6
4
2
0
−2
−4
−6
−8
−10
0.36
0.37
0.38
0.39
0.4
Time (sec)
(c) The steady-state tracking error in Case (b) above. The white line shows the steady-state
tracking error in Case (a) above.
Figure 4.7
Output voltage
u
o
and tracking error
e
with the nominal load when
i
d
=
0


Search WWH ::

Custom Search