Databases Reference
In-Depth Information
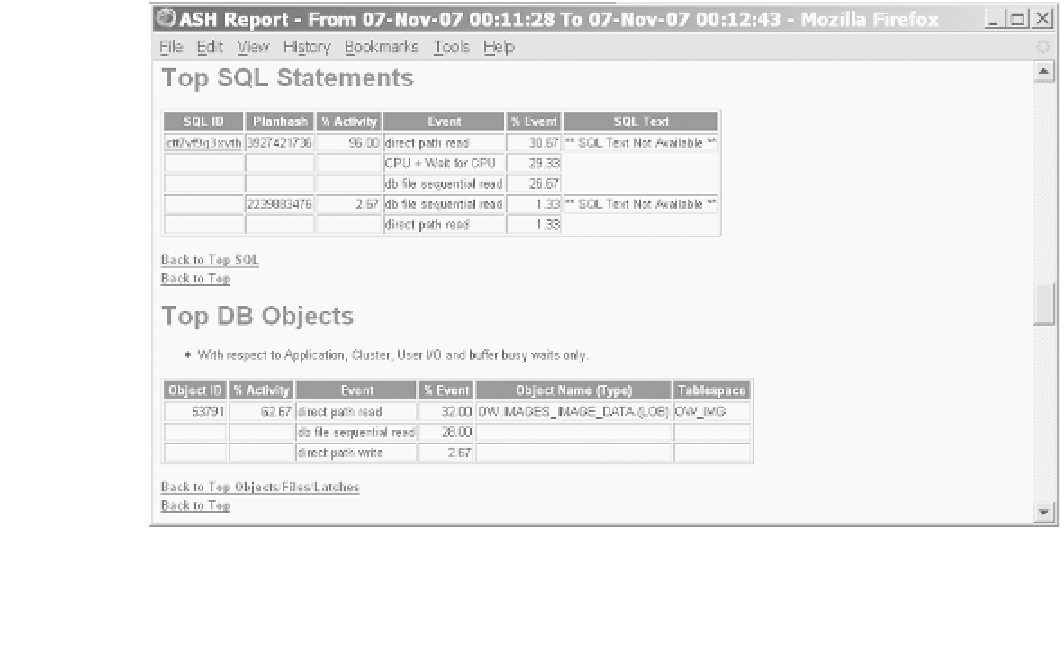
Figure 28-1.
Top SQL Statements section of an Active Session History report
According to the ESQLTRCPROF report, 71 rows were inserted into the table
IMAGES
.
Hash Value: 3858514115 - Total Elapsed Time (excluding think time): 0.146s
INSERT INTO images (id, date_loaded, exif_make, exif_model, exif_create_date,
exif_iso, exif_f_number, exif_exposure_time, exif_35mm_focal_length, image_data)
VALUES(:id, sysdate, :exif_make, :exif_model,
to_date(:exif_create_date, 'yyyy:mm:dd hh24:mi:ss'),
:exif_iso, :exif_f_number, :exif_exposure_time, :exif_35mm_focal_length,
empty_blob())
DB Call Count Elapsed CPU Disk Query Current Rows
------- -------- ---------- ---------- -------- -------- -------- --------
PARSE 71 0.0026s 0.0156s 0 0 0 0
EXEC
71
0.1203s 0.0781s 1 71 495 71
FETCH 0 0.0000s 0.0000s 0 0 0 0
------- -------- ---------- ---------- -------- -------- -------- --------
Total 142 0.1229s 0.0938s 1 71 495 71
Since the interval covered by the trace file was 74.9 seconds, 56 LOBs were inserted per
minute. What struck me was that there were also 71 parse calls for this
INSERT
statement. This
was an indication that the parse call for the
INSERT
statement was done in a loop instead of just
once before entering the loop.