Graphics Programs Reference
In-Depth Information
All the
tbody
table rows are set to a
width
of
10%
because you want to place them side by
side, and there are 10 of them, so 100% (the full width of the table) divided by 10 is 10. h en
just place the rows next to each other (see Figure 6-17).
#day02
{
left
:
10%
;}
#day03
{
left
:
20%
;}
#day04
{
left
:
30%
;}
#day05
{
left
:
40%
;}
#day06
{
left
:
50%
;}
#day07
{
left
:
60%
;}
#day08
{
left
:
70%
;}
#day09
{
left
:
80%
;}
#day10
{
left
:
90%
;}
tbody
td
{
bottom
:
0
;}
225
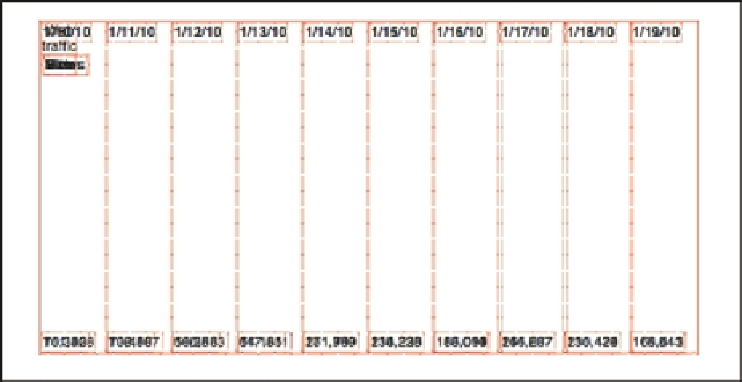
Figure 6-17: Setting up the containment for each bar of the graph.
h is is kind of the tedious part: writing out the let of set for every row. Just imagine doing it
for a whole month! (h at is why you get a script to write this sort of thing out for you instead
of doing it by hand, of course. More on that later.)
At this point, make the bars stand up as appropriate. And this is where it gets really tedious,
because a height has to be computed for every single one and then assigned. Just to get
started, the highest value needs to be determined; in this case, it's
251,969
. h en pick a value
at or above that which represents the very top of the graph. It could be 260,000; 275,000; or
even 300,000. For this example, go with 260,000.
Having done that, next divide every single value by that maximum to get a percentage. So for
the i rst row, which contains the numbers
151,308
and
70,342
, the percentages are 58.2%
and 27.05%, respectively. h ose are the
height
values to assign to the
td
elements in the


Search WWH ::

Custom Search