Graphics Programs Reference
In-Depth Information
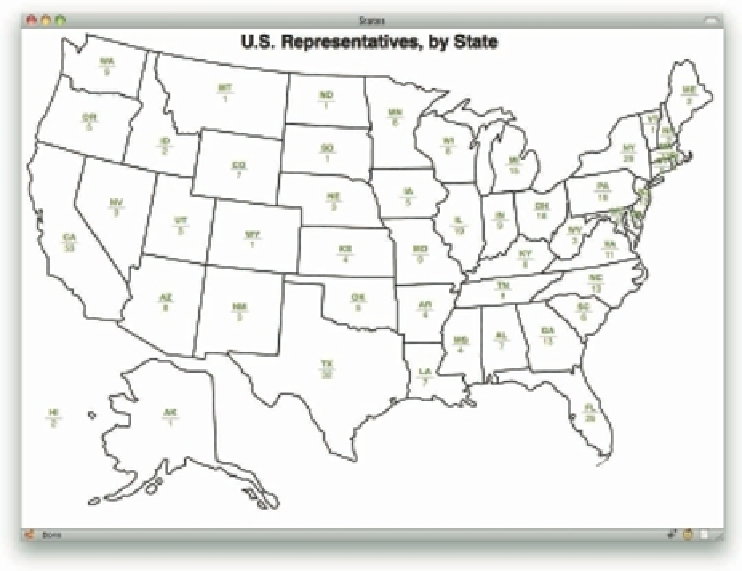
Now you can use the
caption
element as a title for the map (see Figure 6-15) while you also
switch of the
thead
, which has been hanging out in the top-let corner of the map, looking ugly.
thead
{
display
:
none
;}
caption
{
position
:
absolute
;
top
:
0
;
left
:
0
;
right
:
0
;
text-align
:
center
;
font
:
bold
200%
sans-serif
;}
222
Figure 6-15: Using the caption as a graph title.
Excellent! And there you go: a table of data placed on a map. h e data is properly structured,
highly accessible, and visually pleasing in a way a plain old table just isn't.
TABLE GRAPHS
Sometimes, your table of data lends itself to being graphed. Whether it's quarterly proi ts, high
and low temperatures for the past week, or rainfall averages for the year, there are lots of data
sets that can be charted.
Consider something a little closer to home: a set of data describing the number of hits and
pageviews on a Web site for a ten-day period.
<
table
summary="Server
hits
and
pageviews
for
meyerweb.com
over
the
period
1/10/10
to
1/19/10
.">


Search WWH ::

Custom Search