Graphics Programs Reference
In-Depth Information
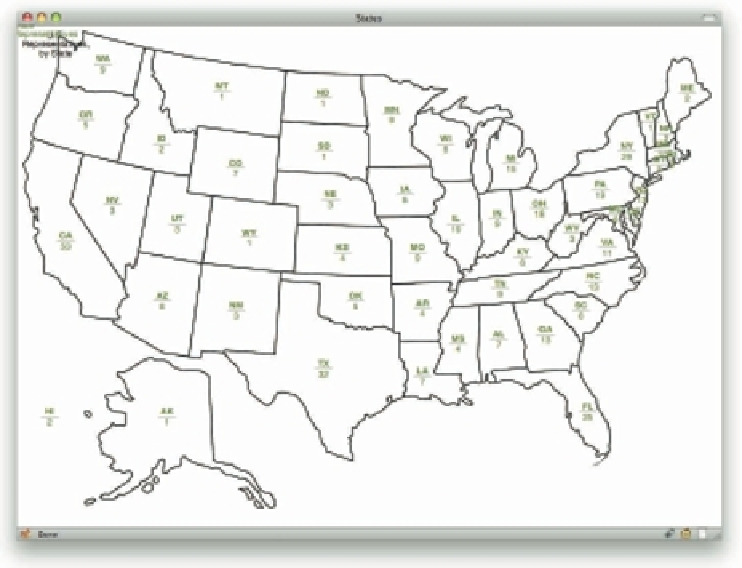
Figure 6-14: Cleaning up the data.
221
I'm actually going to let this stand as is. It serves as a perfect illustration of why you have to be
careful when mapping data onto a table. Yes, there are ways to mitigate the problem with CSS,
like hiding pieces of data boxes in those tiny states and then revealing them on hover. A better
idea might be to pick a map that has sui cient space for each state's data (for example, one which
has the Northeast in magnii ed form, or which has callout lines pointing into the small states).
h e data could then be placed at the end of each callout line. I'll leave it to your imagination.
h ere is one other thing to do here, and that's make the table more accessible than the already
extant
scope
attributes make it. As a bonus, you have something else to style and place. h is
table needs both a summary and a caption.
<
table
summary="A
list
of
American
states
and
the
number
of
representatives
allocated
to
each
in
the
United
States
House
of
Representatives
,
which
is
the
lower
chamber
of
the
United
States
Congress.">
<
caption>U.S.
Representatives
,
by
State<
/
caption>
<
thead>


Search WWH ::

Custom Search