Biomedical Engineering Reference
In-Depth Information
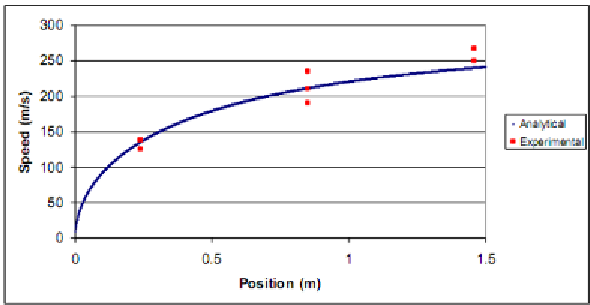
Figure 37 shows the analytical prediction for velocity as a function of
position along with experimental values. The variation in the measured
velocities is largely due to the sample rate of the data acquisition system. Data
was sampled at 51200 Hz - the maximum rate for the system. However, a
higher rate would have reduced the uncertainty in velocity. At this sample rate,
Δt=1.953 x 10
-5
sec. This results in an uncertainty in velocity that is a function
of the velocity. If the time required for the ball to pass the photodetector is nΔt
(where n is an integer), then the velocity of the ball is
d
V
(10)
n
t
where d is the diameter of the ball. If the uncertainty in time is Δt/2, then
there are two expressions for the resulting uncertainty in velocity.
d
d
d
d
V
for
n
1
1
2
n
t
n
t
2
n
n
t
2
n
t
1
2
2
(11)
d
d
d
d
V
for
n
1
1
n
t
2
n
n
t
2
n
t
1
2
n
t
2
2
Reproduced with permission. Copyright retained by Inderscience Publishers.
Figure 37. Experimental Results versus Results from the First Order Analysis.
After the ball exited the barrel, there was a low amplitude oscillation of
the air pressure in the barrel (Figure 38). The data presented here has been
filtered to remove the low frequency components that dominate the signal. The