Biomedical Engineering Reference
In-Depth Information
Reproduced with permission. Copyright retained by Inderscience Publishers.
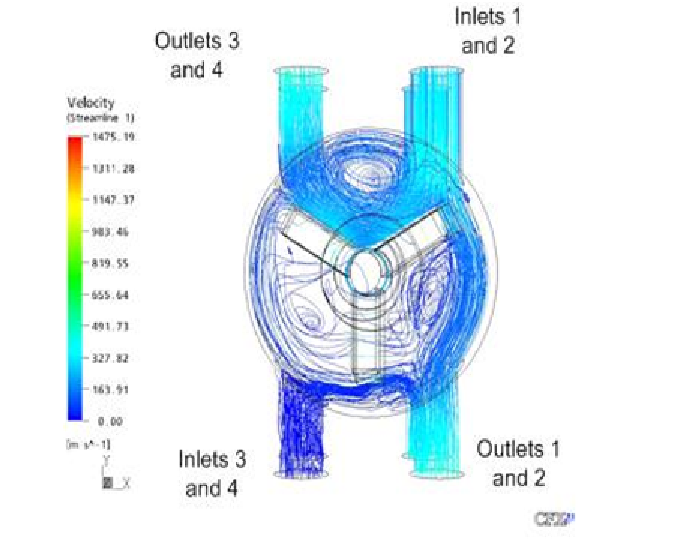
Figure 9. Stream lines describing the flow pattern of two-stage rotor for two million
rpm rotational speed of rotor.
Pressure Variation
In Figure 10, static pressure distribution of spindle geometry obtained
from the numerical simulation of rotor is shown parallel to the X-Y plane at a
distance of 3 mm from one side of the rotor (and at a distance of 11 mm from
the other side of the rotor) in the z-direction. Air entering from the lower part
of the housing impinges directly on the rotor blade surface and the total kinetic
energy of the fluid gets converted into the pressure energy due to the
stagnation of the fluid. Therefore, the maximum pressure is observed in the
vicinity of the leading edge of the rotor blades, which bifurcate the inlet stream
entering from the lower part of the housing. Figure 11 shows the static
pressure distribution on the rotor. The pressure distribution was found to be
symmetric on the blades of the rotor.