Chemistry Reference
In-Depth Information
1.8
x
0
20
S
0
0.5
0.75
1
1.25
1.5
1.75
L
2
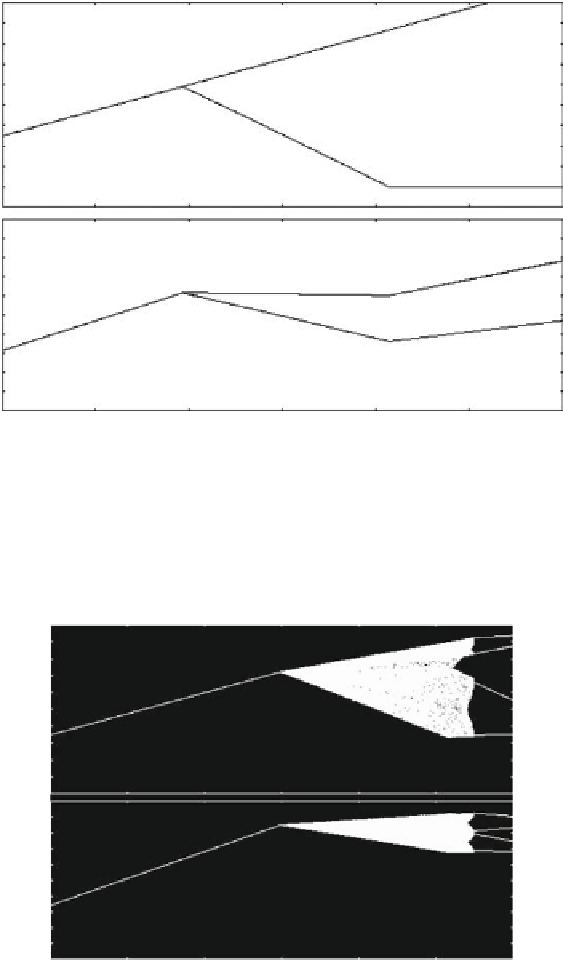
Fig. 4.14
The oligopoly model with intertemporal demand interaction and adaptive adjustment in
the discrete time case. The N-firm symmetric model with iso-elastic price function and linear cost
functions. Bifurcation diagrams with respect to L when the number of firms is increased to N
5
and a is increased to the value 1. Other parameters are as in Fig. 4.13. The bifurcation occurs at
L ' 0:98, at which point a stable 2 cycle is born
D
1.8
x
0
22
S
0
0.5
0.75
1
1.25
1.5
1.75
L
2
Fig. 4.15
The oligopoly model with intertemporal demand interaction and adaptive adjustment in
the discrete time case. The N-firm symmetric model with iso-elastic price function and linear cost
functions. Bifurcation diagrams with respect to L when the number of firms is increased further
to N D 6. Other parametric changes with respect to Fig. 4.14 are a D 0:7 and c D 0:1, whilst
ˇ remains at the value 0:6. The bifurcation now occurs at L ' 1:24, at which point a chaotic
attractor appears
Search WWH ::

Custom Search