Environmental Engineering Reference
In-Depth Information
perature at the surface of the earth in the respective region (i.e. 9 to 10 °C in Cen-
tral Europe) /2-4/.
Deep underground.
Different heat transfer processes lead to varying tempera-
tures at the same depth. The local thermal temperature gradient can thus deviate
significantly from the regional or the global mean value.
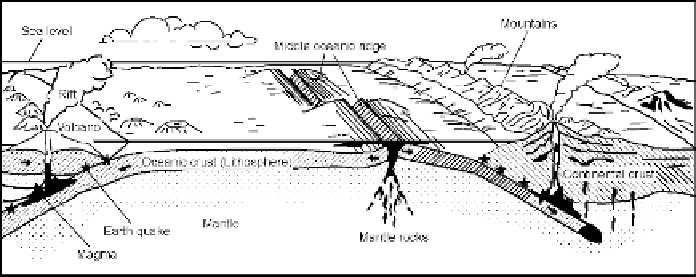
The geothermal heat flow gradient can be influenced by volcanic and tectonic
activities. Fig. 2.60 gives a schematic view over the most important sources of
geothermal heat with respect to the dynamic behaviour of the earth. High potential
of geothermal energy is given at the middle oceanic ridges. Here, the oceanic crust
is relatively thin and hot mantle rock is uplifted close to the earth's surface. This
is, for example, the case in Iceland where geothermal energy already contributes
substantially to the energy demand. Fig. 2.60 also shows that high potentials for
using geothermal power are also given where the oceanic crust moves below the
continental crust. At the border between the two plates, hot mantle rock might
move upwards and become visible in the form of volcanoes.
Fig. 2.60
View of the dynamic earth with possible geothermal heat reservoirs (see /4-42)
Typical examples for this type of geothermal activity are the numerous volca-
noes located along the Andes in South America. Even when it is difficult to tap
the energy of volcanoes directly in geological periods post volcanic areas with
relatively high temperatures in shallow depth are potential areas for the use of
geothermal energy. The Geysers field in California/USA and the geothermal fields
in New Zealand are examples for this type of geothermal resources.
Also, other areas like the continental crust (e.g. the Eurasian plate; see
Fig. 2.55) show considerable heat flows. Therefore Fig. 2.61 illustrates the heat
flow density in parts of Europe according to the current status of knowledge. Ac-
cording to this map areas are visible which are characterised by a relatively high
heat flow density. This is for example valid for the Upper Rhine Valley and for
large areas south of Paris. Very high heat flow densities are given in Tuscany; this
is the area where the first geothermal power was installed and brought to opera-
tion.
Search WWH ::

Custom Search