Environmental Engineering Reference
In-Depth Information
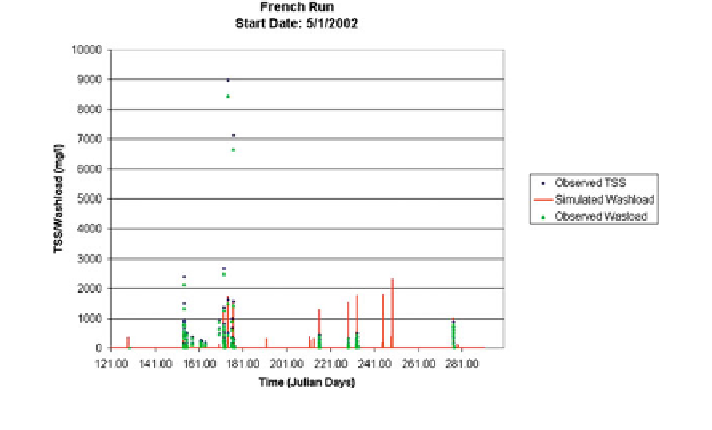
Fig. 8.9
Calibrated and observed total suspended sediment at Franch's Run
Three sediment size fractions were simulated, sand, silt, and clay. The model
was calibrated to two observed events that occurred in June 2002 using the
hydrologic parameters from calibration 1. Observed values of total suspended
solids (TSS) and flow were combined according to USGS standards to produce
sediment discharge (m
3
s
-1
) and compared to the model stream values of wash
load, which is composed of clay and silt size fractions. The sand is expected and
assumed to move as bed load and not be in TSS measurements. The calibration
results are shown in Fig.
8.8
. The MAE for the total sediment discharge (m
3
) for
the two events was 12 and 4 percent of the observed, respectively. In general, the
sediment calibration and verification results are good.
For the field scale, calibrated and observed suspended sediment at French's run
gage is given in Fig.
8.9
.
The nutrient cycling simulation within GSSHA was tested and validated for the
same watershed. In preparing the nutrient loadings, total nitrogen and total
phosphorous were measured, and the soluble forms were estimated from these
totals as inputs. No continuously N and P concentration measurement data were
available. The model calibration for water quality was conducted only for dis-
solved N and P at gages where observed data were available. Based on multiple
GSSHA runs, Fig.
8.10
shows the comparison between observed and modeled
nitrate N and dissolved inorganic P for the same simulation period with the
hydrology. The figure indicates that the trend of modeled nutrient concentration
match with the trend of the measured data.
For the field scale, calibrated and observed flow inorganic phosphorus at
French's run gage is given in Fig.
8.11
.
Search WWH ::

Custom Search