Environmental Engineering Reference
In-Depth Information
quality of life concerns in building design and arrangement. ''Feedback from
community partners suggests that the mapping exercises and 3D visualizations
have fostered new conversations and understanding around the community's future
and growth options'' (Pond et al.
2012
), though significant challenges remain in
terms of separation between official decision-makers and local community con-
cerns, due to distance and limitations of conventional planning methods still in
place.
7.3.3.3 A Case Study at Regional Scale
In Toronto, the case study applied geovisualization methods and tools to help
policy-makers and, ultimately, the public, explore where planning policy and
mitigation efforts can best be targeted. Two main research foci were identified:
reducing heat island effects and increasing green energy production through
rooftop photovoltaics. The visualization approaches were driven by a need to help
decision makers (e.g. City staff, individual homeowners, etc.) to interactively
explore spatial variability in heat and rooftop PV suitability, and to identify tan-
gible linkages between policies and action strategies across multiple scales (Pond
et al.
2012
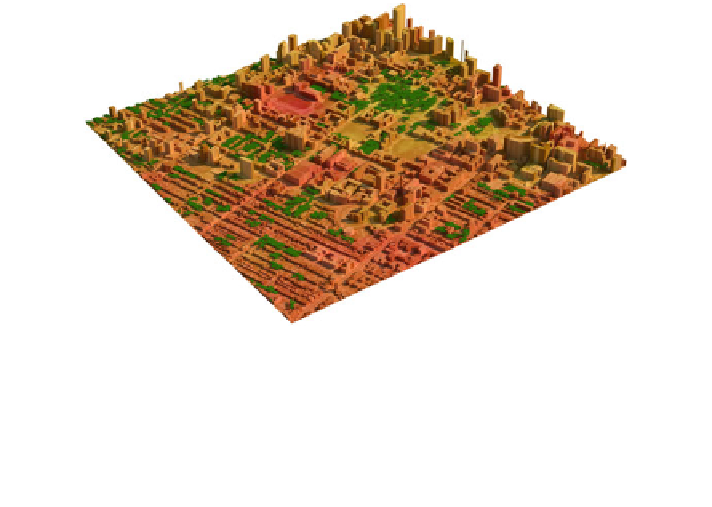
). This involved: mapping variations in surface heat using surface
temperature variations represented as topographic surfaces on which orthophotos
were draped to highlight correspondence between land use and heat effects
(Fig.
7.7
); development of a web-GIS application and solar modelling to explore
Fig. 7.7 3D model of urban heat island in Toronto: colours represent surface temperatures,
showing the cooling effect of vegetation (tree canopy shown in green). Credit J. Danahy. Data
source: Maloley, MJ. 2010. Thermal remote sensing of Urban Heat Island Effects: Greater
Toronto Area, Geological Survey of Canada, open file 6283, 40 pages. doi:
10.4095/26339
;
Behan, KJ, Mate, D, Maloley, MJ, Penney J 2011. Using strategic partnerships to advance urban
heat island adaptation in the greater Toronto Area. Geological Survey of Canada, open file 6865.
1 CD-ROM. doi:
10.4095/288755
. Reproduced from Sheppard (
2012
) ''Visualizing Climate
Change'', Earthscan/Routledge
Search WWH ::

Custom Search