Environmental Engineering Reference
In-Depth Information
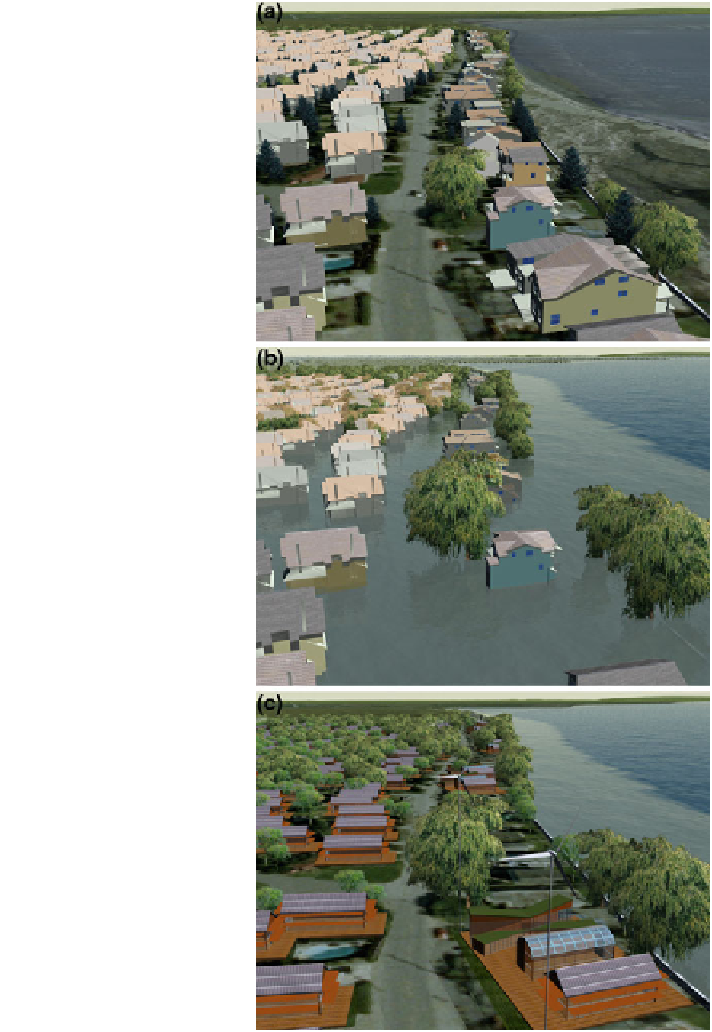
Fig. 7.3 3D visualisations of
alternative conditions in a BC
coastal community at risk of
flooding: a Existing
conditions in 2000.
b Projection of same
neighbourhood in 2100 with a
+4 C global warming
scenario, storm surge, and no
effective adaptation
measures. c Projection of
same area in 2100 with a low-
carbon resilient scenario,
storm surge, raised sea-wall,
flood-proofed buildings, and
on-site energy generation
(intensive mitigation). Credit
David Flanders, CALP, UBC;
sea level data provided by
Natural Resources Canada.
Reproduced from Sheppard
(
2008
), ''Local Climate
Change Visioning'', Plan
Canada, with permission of
Canadian Institute of
Planners; and from Sheppard
et al. (
2008
), ''Can
Visualization Save the
World?'' Digital design in
landscape architecture 2008,
9th international conference
Anhalt
Search WWH ::

Custom Search