Biomedical Engineering Reference
In-Depth Information
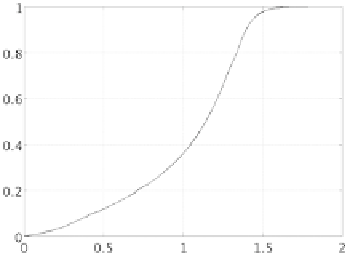
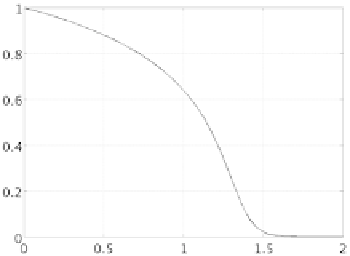
Fig. 11.6.
The mean value over
(
0
,
L
)
of the non-dimensional partial density of water (left) and
polymer (right)
Fig. 11.7.
A comparison of the predicted water/polimer mixture densities provided by micro and
macroscale models (left). On the right we show a transverse section at
x
300
mixture for different configurations of the system in the lumped state space, i.e.
for different combinations of
. The results are reported in Table 11.2. On the
other hand, the macroscale model is capable to represent how the mean value of total
mixture density evolves in the lumped state space, that is
(
φ
,
x
)
w
L
0
ρ
φ
w
(
)
dz
¯
ρ
(
φ
w
,
x
)=
t
,
z
)
,
x
(
t
,
z
.
Such micro and macroscale data are only indirectly correlated, because the macro-
scale model was fitted on the diffusivity provided by atomistic simulations. By con-
sequence, their comparison represents a significant and quantitative indicator of the
multiscale model capability to represent polymer degradation. In Fig. 11.7, we rep-
resent on the left a biquadratic interpolation of the density dataset of Table 11.2
where the control points are depicted with dots. On this surface, we superpose the
evolution of ¯
computed with the macroscale model. The agreement is rather
satisfactory, as also confirmed by the transverse section at
x
300
of Fig. 11.7 (left),
which is reported on the right.
ρ
(
φ
w
,
x
)