Biomedical Engineering Reference
In-Depth Information
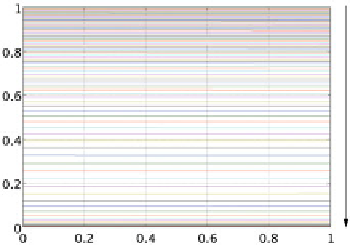
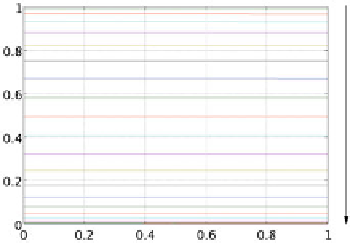
Fig. 11.4.
The non-dimensional partial densities
ρ
w
(
t
,
z
)
,
ρ
(
t
,
z
)=
∑
˜
ρ
i
(
t
,
z
)
are reported on top,
i
10
1
10
i
=
1
40
31
40
i
=
31
while
are depicted at the bottom. The abscissa represents
the non-dimensional coordinate along the coating thickness,
z
, and the time evolution is indicated
with the arrows on the right of each picture
ρ
=
∑
ρ
i
(
t
,
z
)
,
ρ
=
∑
ρ
i
(
t
,
z
)
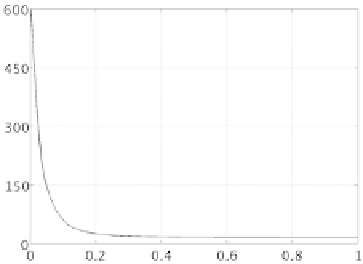
Fig. 11.5.
The trajectory of the system in the
(
φ
,
x
)
phase space
w
For a bulk eroding polymer such diagrams are expected to feature a sigmoid shape
as confirmed by the results, reported in Fig. 11.6.
Finally, we observe that the combination of microscale with macroscale models
allows us to perform a quantitative validation, which is based on the comparison
of the total density of the water/polymer mixture along the degradation process. On
one hand, the microscale model provides, beside diffusivity, the total density of the