Biomedical Engineering Reference
In-Depth Information
(a)
t
/
T
=
.
(b)
t
/
T
=
.
(c)
t
/
T
=
.
0
2.
0
4.
0
5.
(d)
t
/
T
=
0
.
6.
(e)
t
/
T
=
0
.
7.
(f)
t
/
T
=
0
.
8.
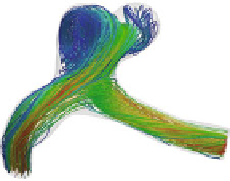
Fig. 9.12.
Blood flow pattern in the aneurismal region
Fig. 9.13.
WSS and OSI hemodynamics indices in the cerebral aneurism
the aneurism, inside the bleb, which leads to an oscillatory behaviour of the shear
stresses as seen in Fig. 9.13, as well as to low values of shear stresses. The main vor-
tical structure observed inside the aneurism in Fig. 9.12 produces also large values
of the OSI index on the lateral part of the arterial wall.
The positioning of the aneurism is such that there is a jet inflow induced in the
intra-aneurismal region, producing a marked main stream inside the aneurism and
generating a large WSS region in the impaction zone (see Fig. 9.13). The bleb is
adjacent to the impaction zone, near the region of large WSS over the aneurismal
wall. This may suggest that the bleb occured in an impaction region with a former
large value of WSS (see [14] and references therein for a complete discussion on
this topic).