Biomedical Engineering Reference
In-Depth Information
Fig. 8.10.
Imaging techniques used to measure cardiac structure and function at multiple spatial
scales
which a specimen is imaged with a collimated X-ray source from multiple incident
angles to build a 3D tomographic reconstruction, provides about 5nm resolution on
suitable contrast enhanced tissue (Fig- 8.10d). Magnetic resonance imaging (MRI)
has the capacity to image intact organs at about 0.1mm resolution (see Fig. 8.10e)
and when used with tagging can provide direct information on tissue movement in
a clinical setting. A number of other imaging technologies, such as helical scan CT,
positron emission tomography (PET) and ultrasound (US), are used clinically for
non-invasive imaging of structure and function at about 1mm resolution.
Image segmentation and modelling at different spatial scales
The process of creating anatomical models from these images and then solving the
equations representing biophysical processes is illustrated at various spatial scales in
Fig. 8.11, from organ system (top) to subcellular (bottom). In each case the process
of creating the anatomical model is similar: The raw image data in the first column
on the left is processed and segmented to provide a clearly defined boundary (second
column) from which a computational mesh can be generated (third column). Finally,
the computational mesh (right hand column) is used to solve systems of equations
representing the governing physical principles - such as conservation of mass, con-
servation of momentum and conservation of charge.
The first row (labeled 'organ system') in Fig. 8.11 shows an image of the torso,
followed by the segmented boundaries of the structures within the torso (heart, lungs,
thoracic muscles and skin). The 3
rd
and 4
th
images are the computational mesh and
the potential distribution on the skin surface generated by currents flowing out of
the heart and into the thoracic cavity. The second ('organ') row shows an MRI im-
age of the heart in the torso, from which the endocardial and epicardial ventricular
surfaces (2
nd
image) are segmented to produce the computational heart mesh (3
rd
image). The final image shows the predictions of the electrical activation and me-
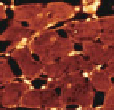
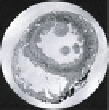
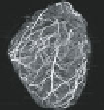
chanical contraction of the ventricular myocardium. The third ('tissue') row shows
first the raw data from confocal imaging, followed by the segmented collagen struc-
ture, then a computational mesh based on the myocardial sheet structure and finally
a prediction of the activation wavefront moving through the tissue structure. The
fourth ('cell') row shows an electron microscopy image of the cardiac myocyte fol-