Biomedical Engineering Reference
In-Depth Information
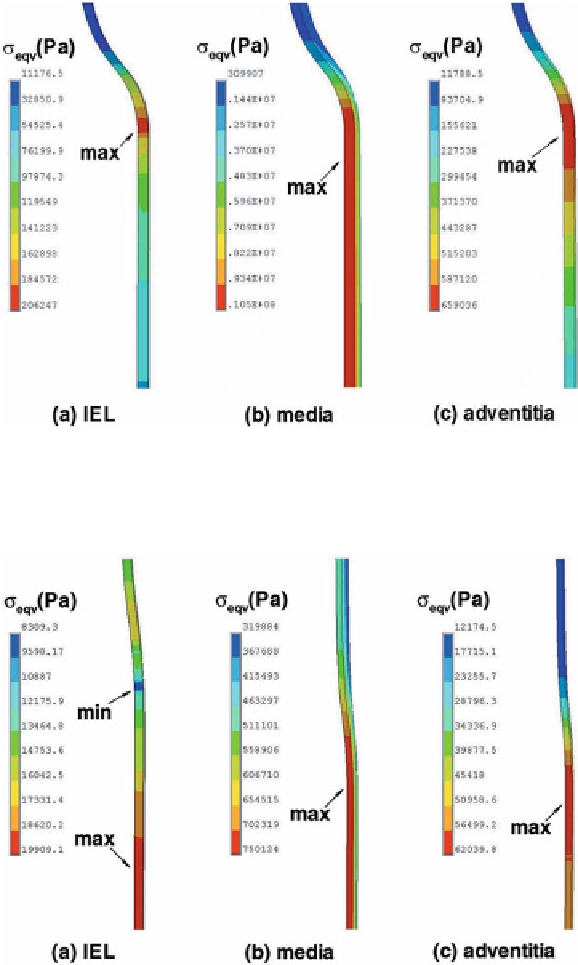
Fig. 6.18.
Distributions of the von Mises stresses in the IEL, media and adventitia layers at 120 %
oversized dilatation state (an intermediate state between States B and C in Fig. 6.15). The arrows
indicate the locations of the maximum stresses
Fig. 6.19.
Distributions of the von Mises stresses in the IEL, media and adventitia layers under
normal arterial loads, but after angioplasty (State D). The arrows indicate the locations of the max-
imum stresses