Image Processing Reference
In-Depth Information
(a)
(b)
1000
1000
3
6
R1
9
800
600
400
800
600
400
200
0
-200
-400
-600
-800
200
0
-200
-400
-600
-800
r1
c1
10
r2
sq1
2
5
8
1
R2
4
7
-1000
-1000
-1000 -800 -600 -400 -200
0
200
400
600
800
1000
-1000 -800 -600 -400 -200
0
200
400
600
800
1000
(c)
(d)
Surface: Electric field,
z
component (V/m)
Surface: Electric field norm (V/m)
2.036
1.98
1000
1000
2
1.5
1
500
500
1.5
0.5
1
0
0
0
-0.5
-1
0.5
-500
-500
-1.5
-1000
-1000
-1.846
1.046×10
-6
-1000
-500
0
500
1000
-1000
-500
0
500
1000
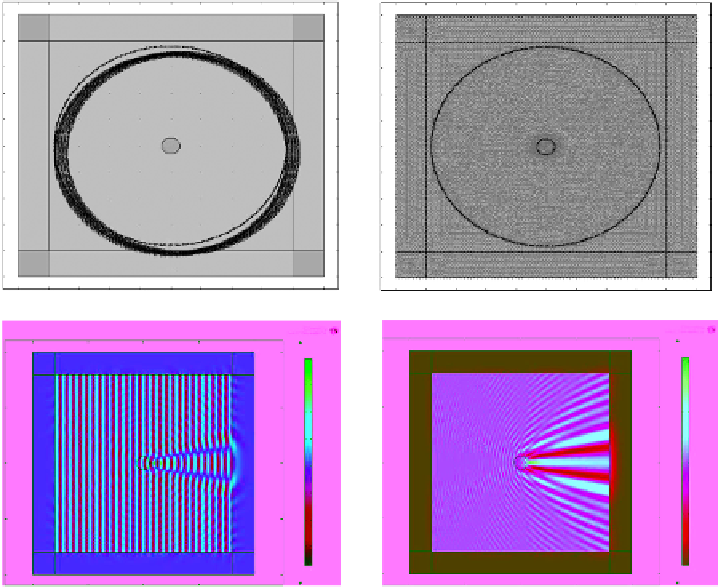
Figure 5.5
(a) Basic model of a circular target (i.e., a cylinder in 3D) in the
x
-
y
plane with a radius of 60 mm. The
larger circle is the location of the 360 receiver points (with I-D tags shown in the lower right of each receiver point). The
square and rectangular sections around the border of the space are matched boundary layers. (b) Basic target model
from (a) with finite element mesh applied. (c) Graphical representation of
E
z
with incident source frequency of 5 GHz
for a target in (a) with a relative permittivity of 1.5. (d) Graphical representation of normalized
E
z
for conditions in (c).
MATLAB modeling process is valid compared to the measured data, the two
images for each target, one from the reconstructed images obtained from the
measured data in Shahid (2009) and one from the simulated data processed
using the same algorithm, respectively, are shown to be comparable in appear-
ance. The target definitions and outputs from both data sets are presented in
Table 5.1 for comparison. There are some obvious differences in appearance,
which is to be expected to some degree.
One major difference in the data sets for at least the first two targets is
that the simulated data was constructed using nine incident sources equally
spaced around the target and the measured data was constructed using eight
incident sources equally spaced around the target. The last two targets both
utilize 18 source locations, again equally spaced around the target. Otherwise,
the setups are virtually identical for each target set. While the evaluation of
images is in general a subjective task, it should be fairly obvious to even the
beginner that the two images are more similar than they are different, sug-
gesting that the structured method described is valid for producing simulated
scattered field data from known structures. This is important to understand
and accept as we use this method to extensively test imaging methods and
ideas in the remainder of this topic.
Search WWH ::

Custom Search