Image Processing Reference
In-Depth Information
(a)
(b)
0
0
0.92
0.03
50
50
0.915
0.025
100
100
0.91
0.02
0.905
150
150
0.015
0.9
200
200
0.01
0.895
250
250
0.005
0.89
300
0
300
0
50
100
150
200
250
300
250
300
50
100
150
200
×10
-0
(c)
(d)
0
0
3.8
3.6
3.4
3.2
3
2.8
2.6
2.4
2.2
2
1.8
30.8
50
50
30.7
100
100
30.6
150
150
30.5
200
30.4
200
30.3
250
250
30.2
300
0
300
0
50
100
150
200
250
300
50
100
150
200
250
300
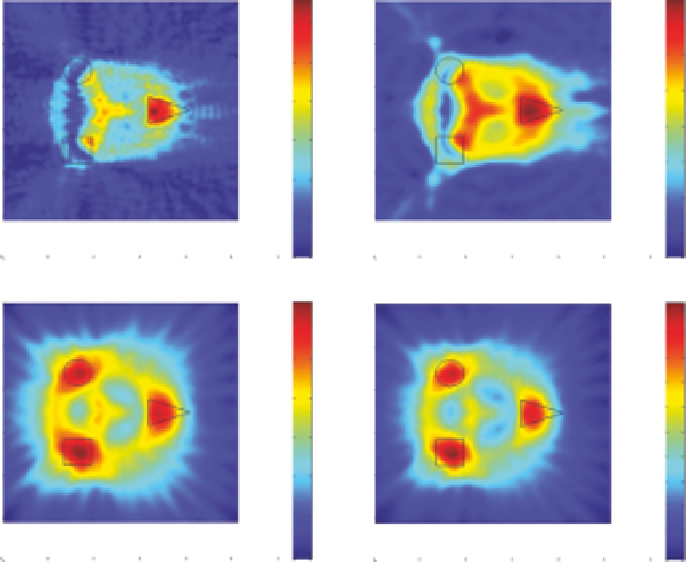
Figure 11.2
Comparison of reconstructed images from various method outputs for a target set consisting of a
circle with radius of
λ
, a square with sides of 2
λ
, and a triangle with base of 2
λ
and height of 3
λ
. All targets have
a permittivity of 1.5. The outputs shown above are from (a) Born approximation, (b) cepstrum of image in (a) using
algorithm developed in Shahid (2009), (c) cepstrum filtering of individual sources that are recombined in image
space, and (d) cepstrum filtering of individual sources that are recombined in image space and have a cepstrum
version
Ψ
in
subtracted in cepstrum space.
encouraging in that the improvement seen going from (a) to (d) is really quite
surprising in relation to the target boundaries. The output for method (d)
clearly shows that there are three distinct targets and makes valid attempts to
show the extent of these boundaries. The scale of the magnitude for (d) is also
very close in range for the index of refraction for the targets of 1.04.
The results shown in Figure 11.2 are encouraging as well, though maybe
not quite as striking as the results shown in Figure 11.1. Again, improvement
is seen going from (a) to (d) in relation to the target boundaries. The output for
method (d) clearly shows again that there are three distinct targets and makes a
fair attempt to show the extent of these boundaries. The scale of the magnitude
for (d) is again very close, actually almost exact in the range for the index of
refraction for the targets, which has an index value of 1.225. This is not as good
an overall performance as that shown in Figure 11.1, but still very encouraging.
The results shown in Figure 11.3 indicate progressively poor overall per-
formance as expected, but the image in (d) does show continued improve-
ment compared to the other methods. As previously stated, improvement is
seen going from method (a) to (d) especially in relation to the target boundar-
ies. The output for method (d) does show again that there are three distinct
Search WWH ::

Custom Search