Image Processing Reference
In-Depth Information
3.50
Good
Fair
Bad
Q
3.00
2.50
2.00
1.50
1.00
0.50
0.00
er
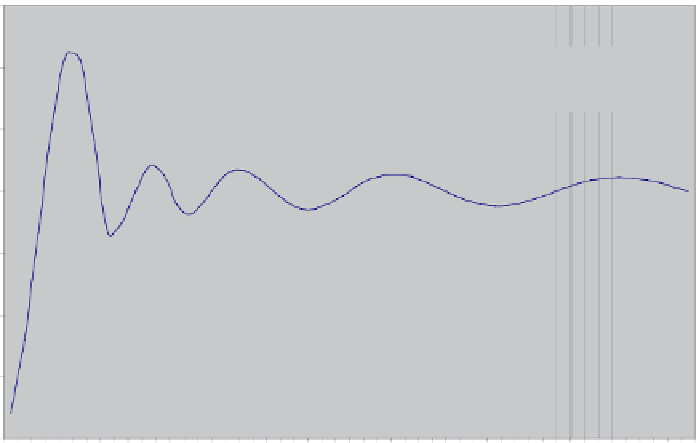
Figure 6.5
Graph showing the plot of the Lorenz-Mie scattering efficiency
Q
factor equation for the same
conditions as the images in Table 6.13. Superimposed on this graph is a column for each image which indicates
the relative quality of the Born reconstruction with green indicating good, yellow indicating fair, and red indicating
poor. This graph demonstrates that when
Q
is “high” or increasing, the image reconstruction is good, and when
Q
is “low” or decreasing, the image is poor.
have a larger than expected area and a more uniform appearance. This also
alludes to a new criterion that could be used to help predict the performance
of an image reconstruction from scattered fields
These resonances can be easily predicted for a Mie scatterer, but this may not
always be the case for more complex targets. However, resonances for specific
target sets could be determined experimentally or via simulation and then pos-
sibly characterized by a closed form equation if one uses a structured method
developed like the one used here. One could experimentally determine enough
resonance points and then use some type of curve-fitting algorithm to deter-
mine a resonance relationship much like the
Q
factor for the Mie scatterers.
This is theoretically possible, but for complex structures, a virtual approach
like the one used here is more straightforward. Assuming the pattern of reso-
nant frequencies for any given target could be inferred from measurements,
then this knowledge could be used to predict the Born approximation-based
image reconstruction as well as providing a tool to investigate the properties of
resonant scattering structures. One very special case of the Lorenz-Mie model
and the scattering cross section indicated by
Q
is when the permittivity is
negative. This is recently of special interest for work currently being done in
the meta-material fields as researchers strive to produce materials with nega-
tive index of refraction. While this is a challenge in the physical realm, it can
be simulated rather easily in the virtual realm. Table 6.13 shows the results for
a cylinder as the permittivity is varied from 1 to −4. It should be noted that if
the permittivity is allowed to go negative, it causes problems for the
Q
equation


Search WWH ::

Custom Search